
[UPDATE – 2 October: After I asked a question about the Need States chart, RAJAR published a revised version of the Podcast chart, and this is now included below.]
RAJAR has just published a summary of its Summer 2024 MIDAS report. The research was carried out amongst 2,048 previous RAJAR respondents across two weeks in July 2024.
And I should briefly remind readers that this is a separate report to regular quarterly RAJAR results and is not directly comparable since it uses a very different methodology.
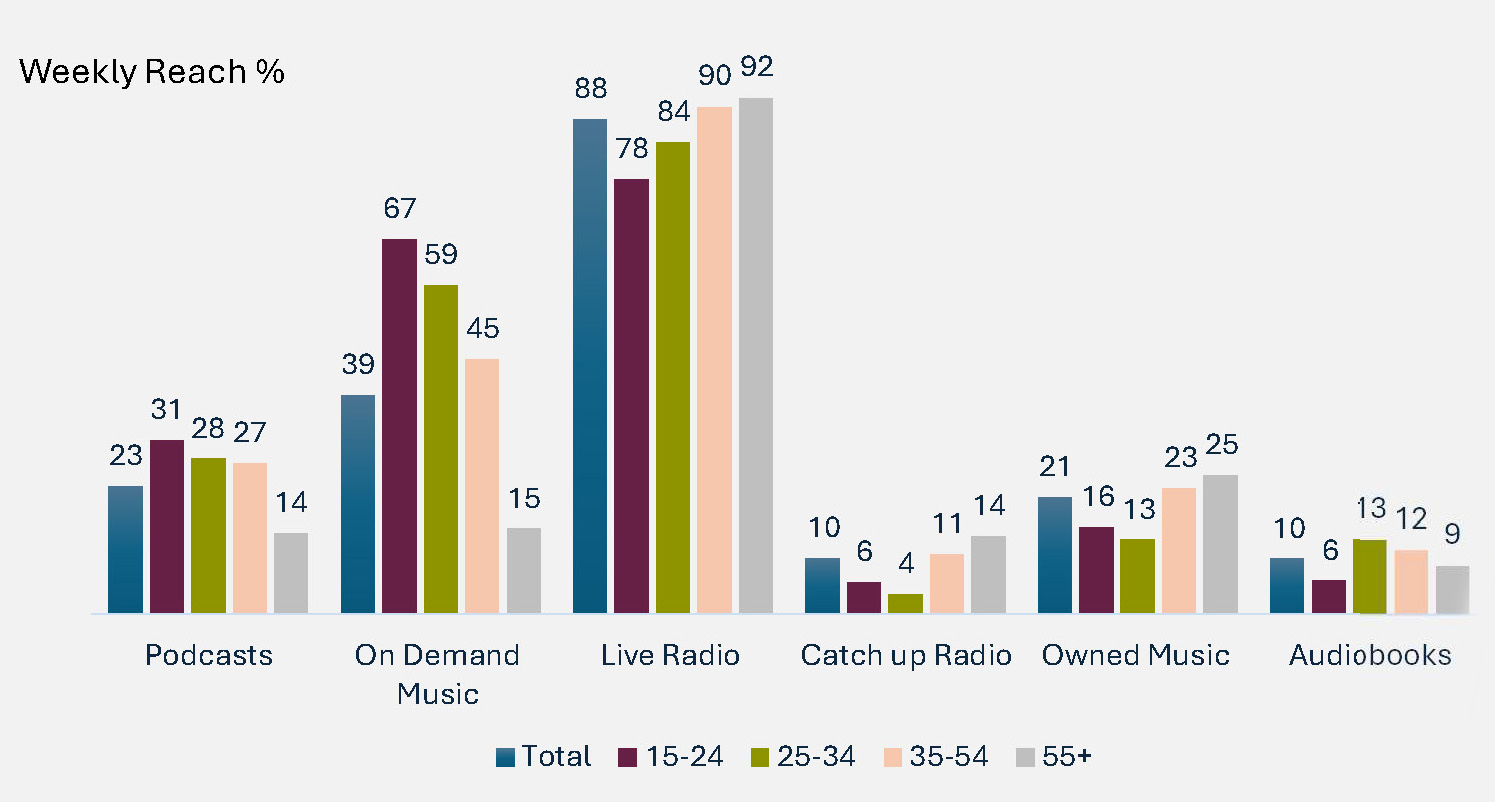
This chart shows the relatively popularity of various kinds of audio listening measured by MIDAS. The radio picture isn’t too surprising, with higher levels of listening the older the listener gets. Podcast and on-demand music listening is the reverse of this.
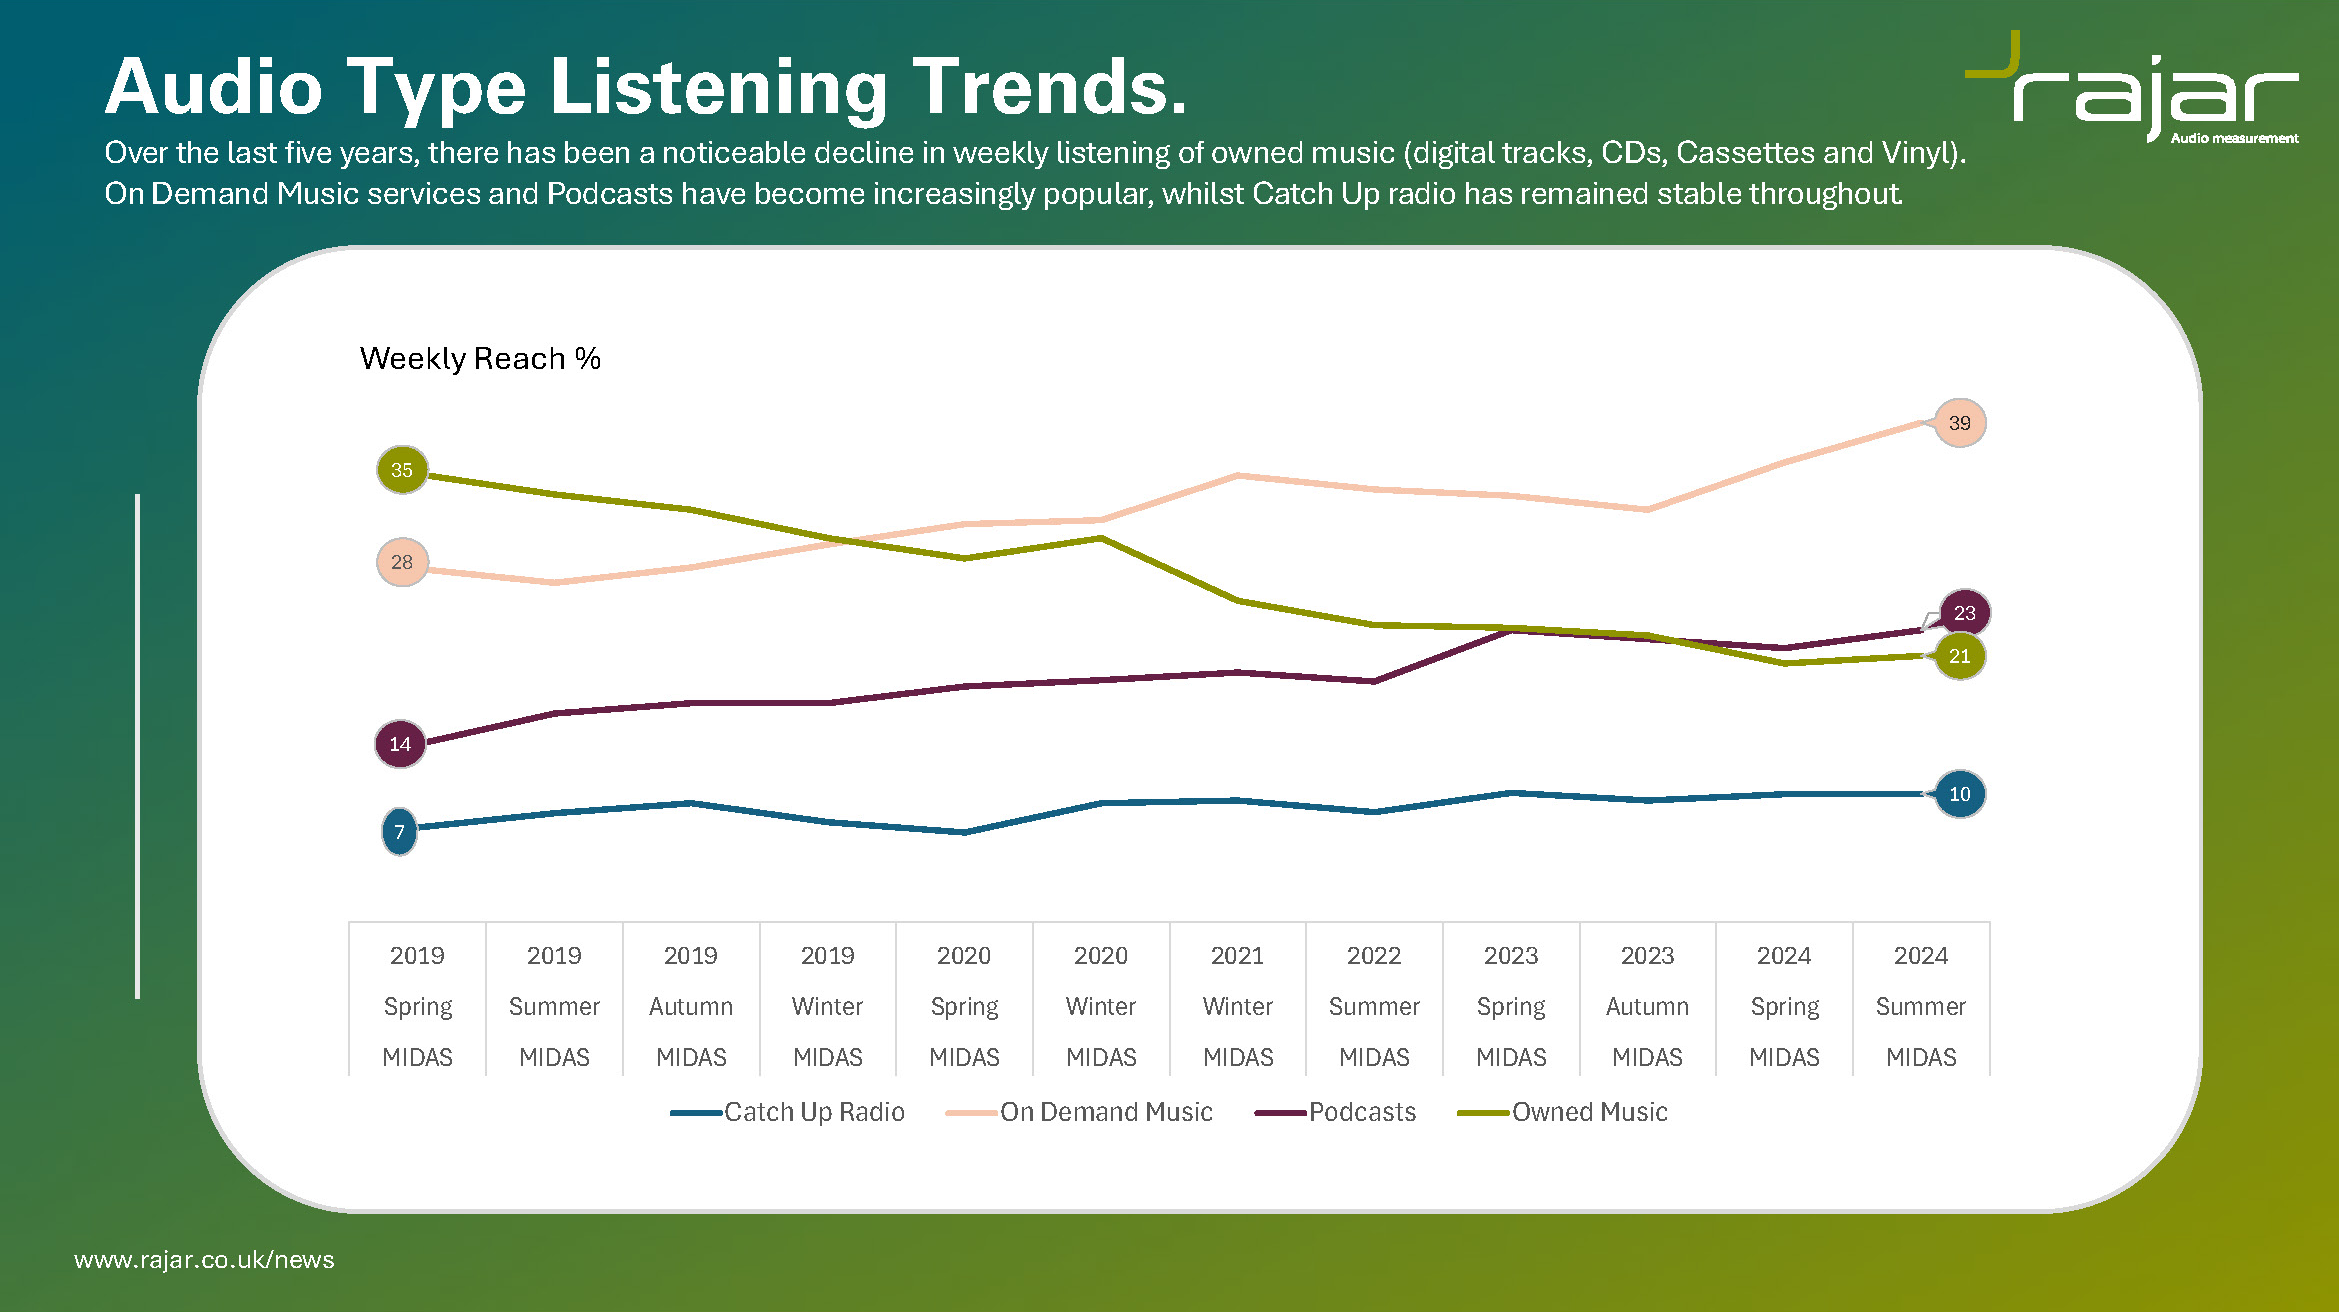
Weekly podcast listening has reached 23% which is as high as it has ever been on this survey and continuing to show an upwards trend. Owned music continues to fall, and is now lower than it has ever been. (Note that radio listening is removed from this chart to ease comprehension of other audio types).
[Note: The following section has been updated since original publication]The MIDAS survey has begun asking respondents about their need states when listening to different kinds of audio, and this really brings into focus the different things people are looking for when they listen to different types of audio.
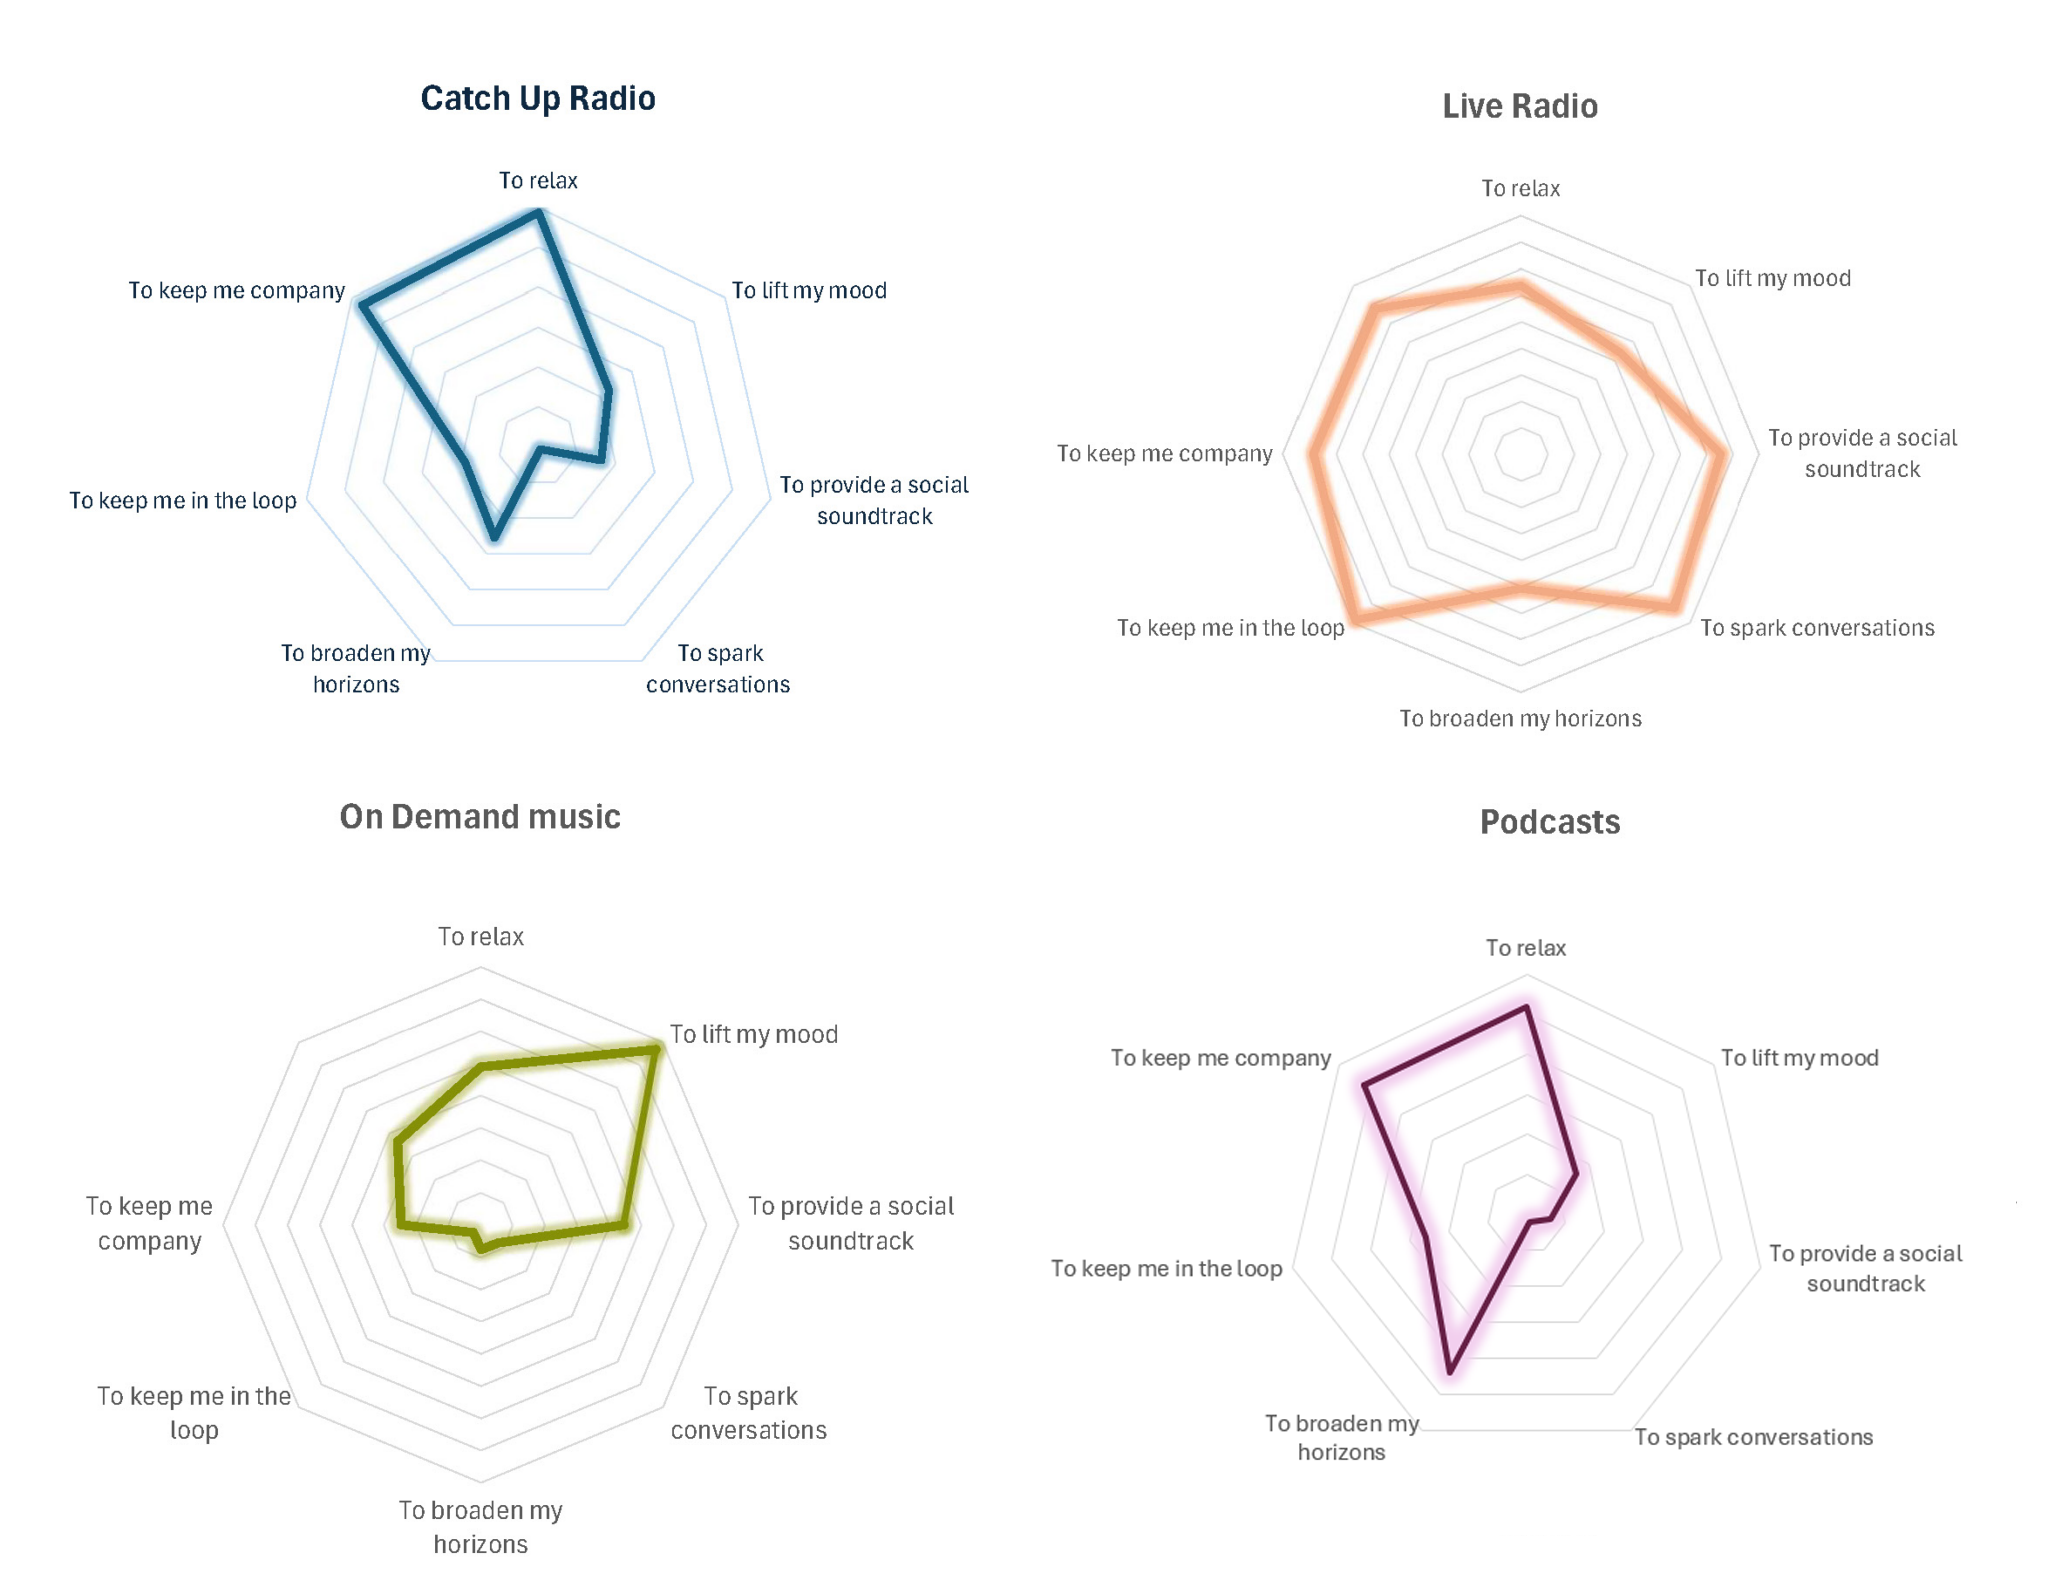
Radio has the broadest range, and I imagine that’s because there are lots of types of radio all serving different purposes. There are very different reasons to listen to BBC Radio 4 or LBC, rather than Magic or Smooth. On Demand music seems very mood based – but you’re not going to be troubled with any speech, interruptions with news or whatever.
The most focused is definitely podcast listening where broadening horizons is incredibly strong. I’m actually surprised by how singular this need state is, since many listen to podcasts at times of the day when they might be thought of as relaxing or mood enhancing.
The revised chart shows that podcasting does indeed still reach those that are looking to broaden their horizons, but it is also there to help listeners relax and to keep them company. It certainly offers something different to On Demand Music which is much more mood oriented.
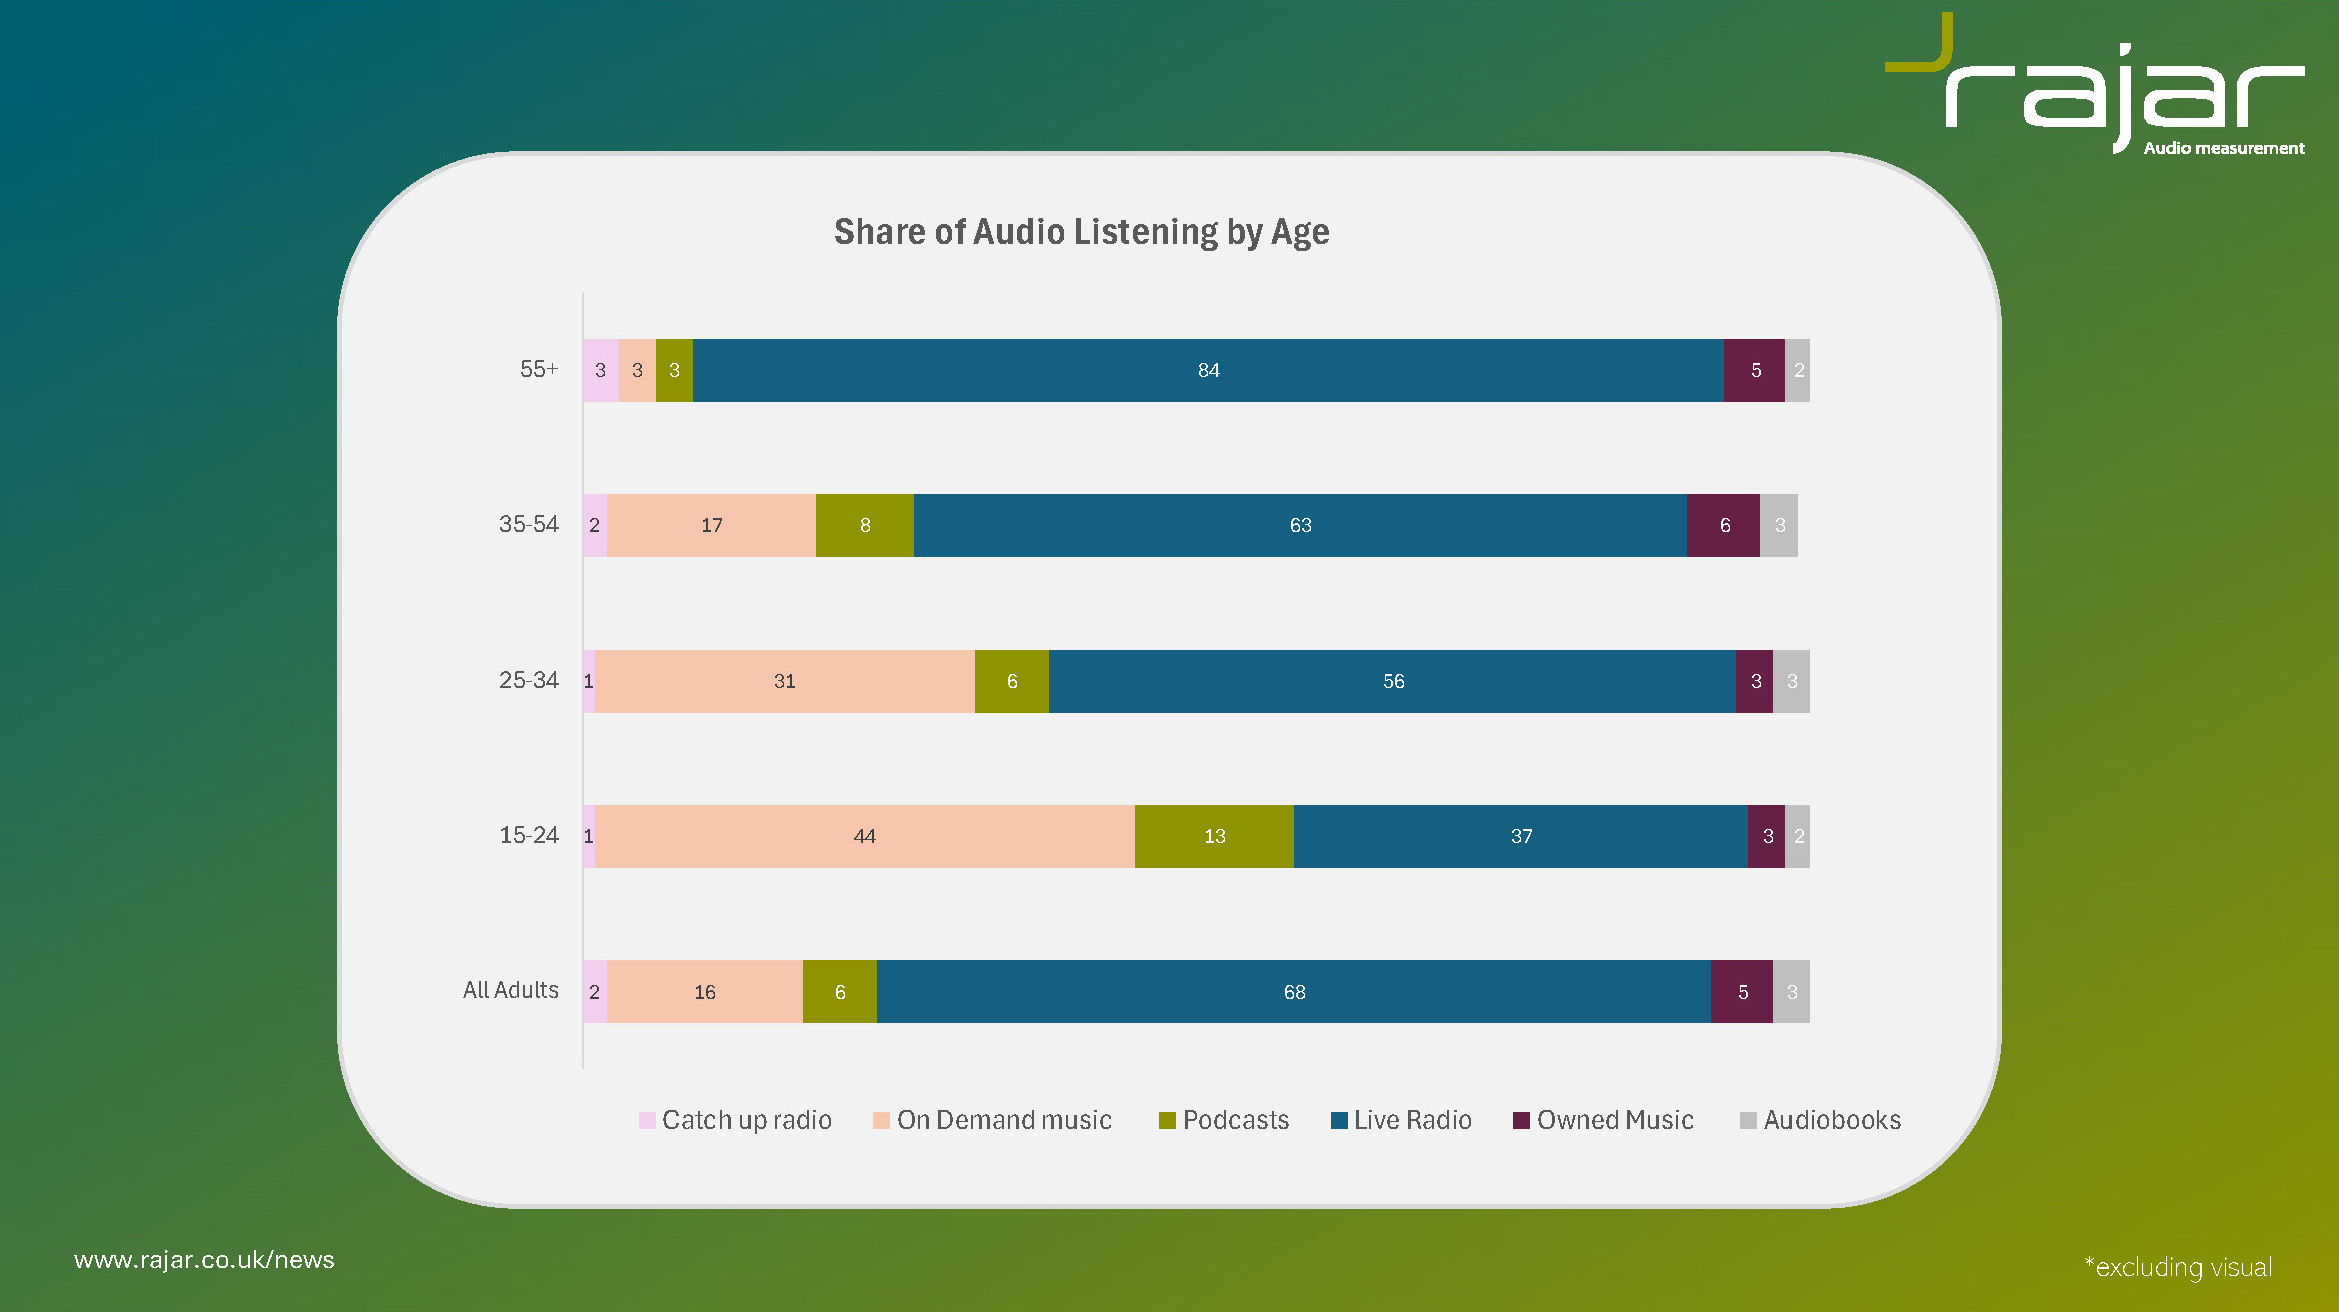
Radio dominates time spent listening – with the exception of 15-24s where On Demand music is the biggest form of audio. But this group also has spends the highest percentage of their time on podcasts.
Returning to podcasts, the 23% of people who listen to podcasts each week listen for around 7 hours per person. 93% of those hours are listened to alone. This increases to 9 hours per person amongst 15-24s. All of these numbers are growing.
And there’s a bit of a reminder that while there are a lot of podcasts out there, 77% of weekly podcast listeners listen to between 1 and 3 episodes a week! 20% listen between 4 and 10, while 3% listen to 11 or more. I might be in that 3%, but it’s the 77% you have to think about…
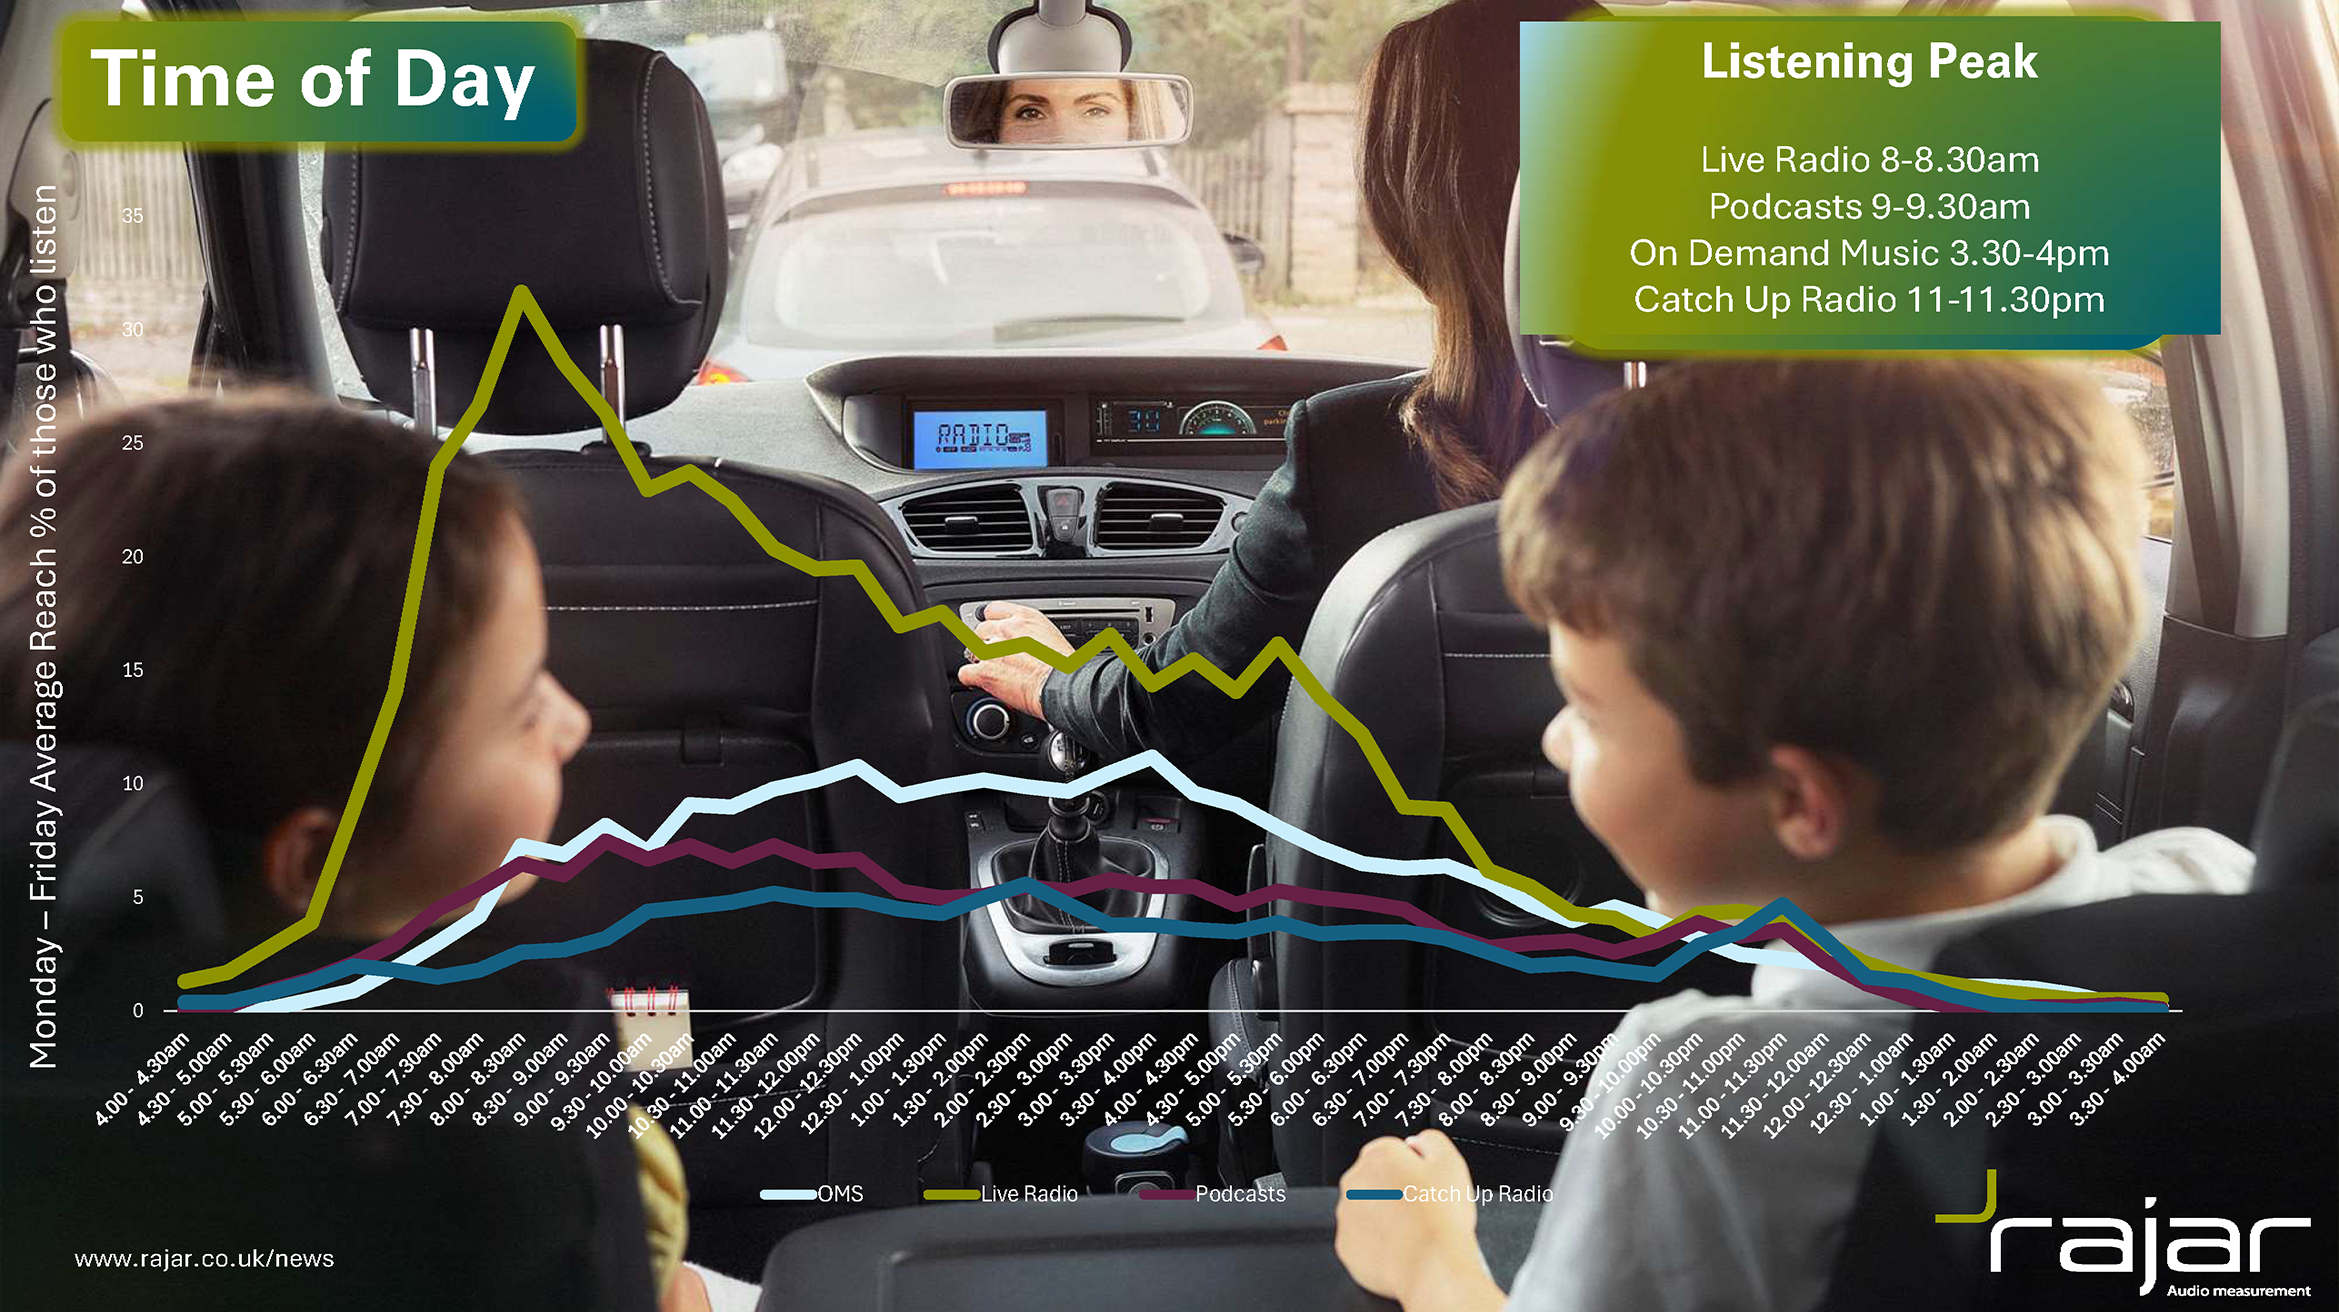
Finally, here’s the time of day chart, showing that live radio peaks when it has basically always peaked, between 8.00-8.30am. There also remains a much smaller “evening drive” peak as well. Podcasts have a less distinct 9.00-9.30am peak, although in truth, they’re listened through the day.
All forms of media get a little boost late into the evening before bed.
Visit RAJAR’s site for the full summary, while subscribers get access to the full data tables.
All Data Source: RAJAR/MIDAS Summer 2024. MIDAS Summer 2024 fieldwork was carried out over two weeks in July 2024 with a final sample of 2,048 former RAJAR respondents’ adults aged 15 plus, completing a 7-day online diary.
Image at the top created in Adobe Photoshop with Adobe Sensei AI using the prompt: “a cartoon dog listening to a podcast as it goes for a walk”
Leave a Reply