Last week RAJAR published the topline findings of its Autumn 2026 MIDAS Survey. This is a recontact survey where RAJAR goes a bit deeper into how audio is being consumed, on what devices and where.
The summary can be found here as a PDF.
Because this data is separately collated, you can’t directly compare it with the regular quarterly RAJAR, which was published a couple of weeks ago.
Before I go any further, I’d note that Matt Deegan has put together a website that trends MIDAS data as far back as it goes, and you should definitely check it out. You can play around by various measures and age breakdowns to see how different forms of audio listening have changed over time.
The topline is that 96% of UK adults listen to some kind of audio each week, listening to 27.8 hours each a week on average.
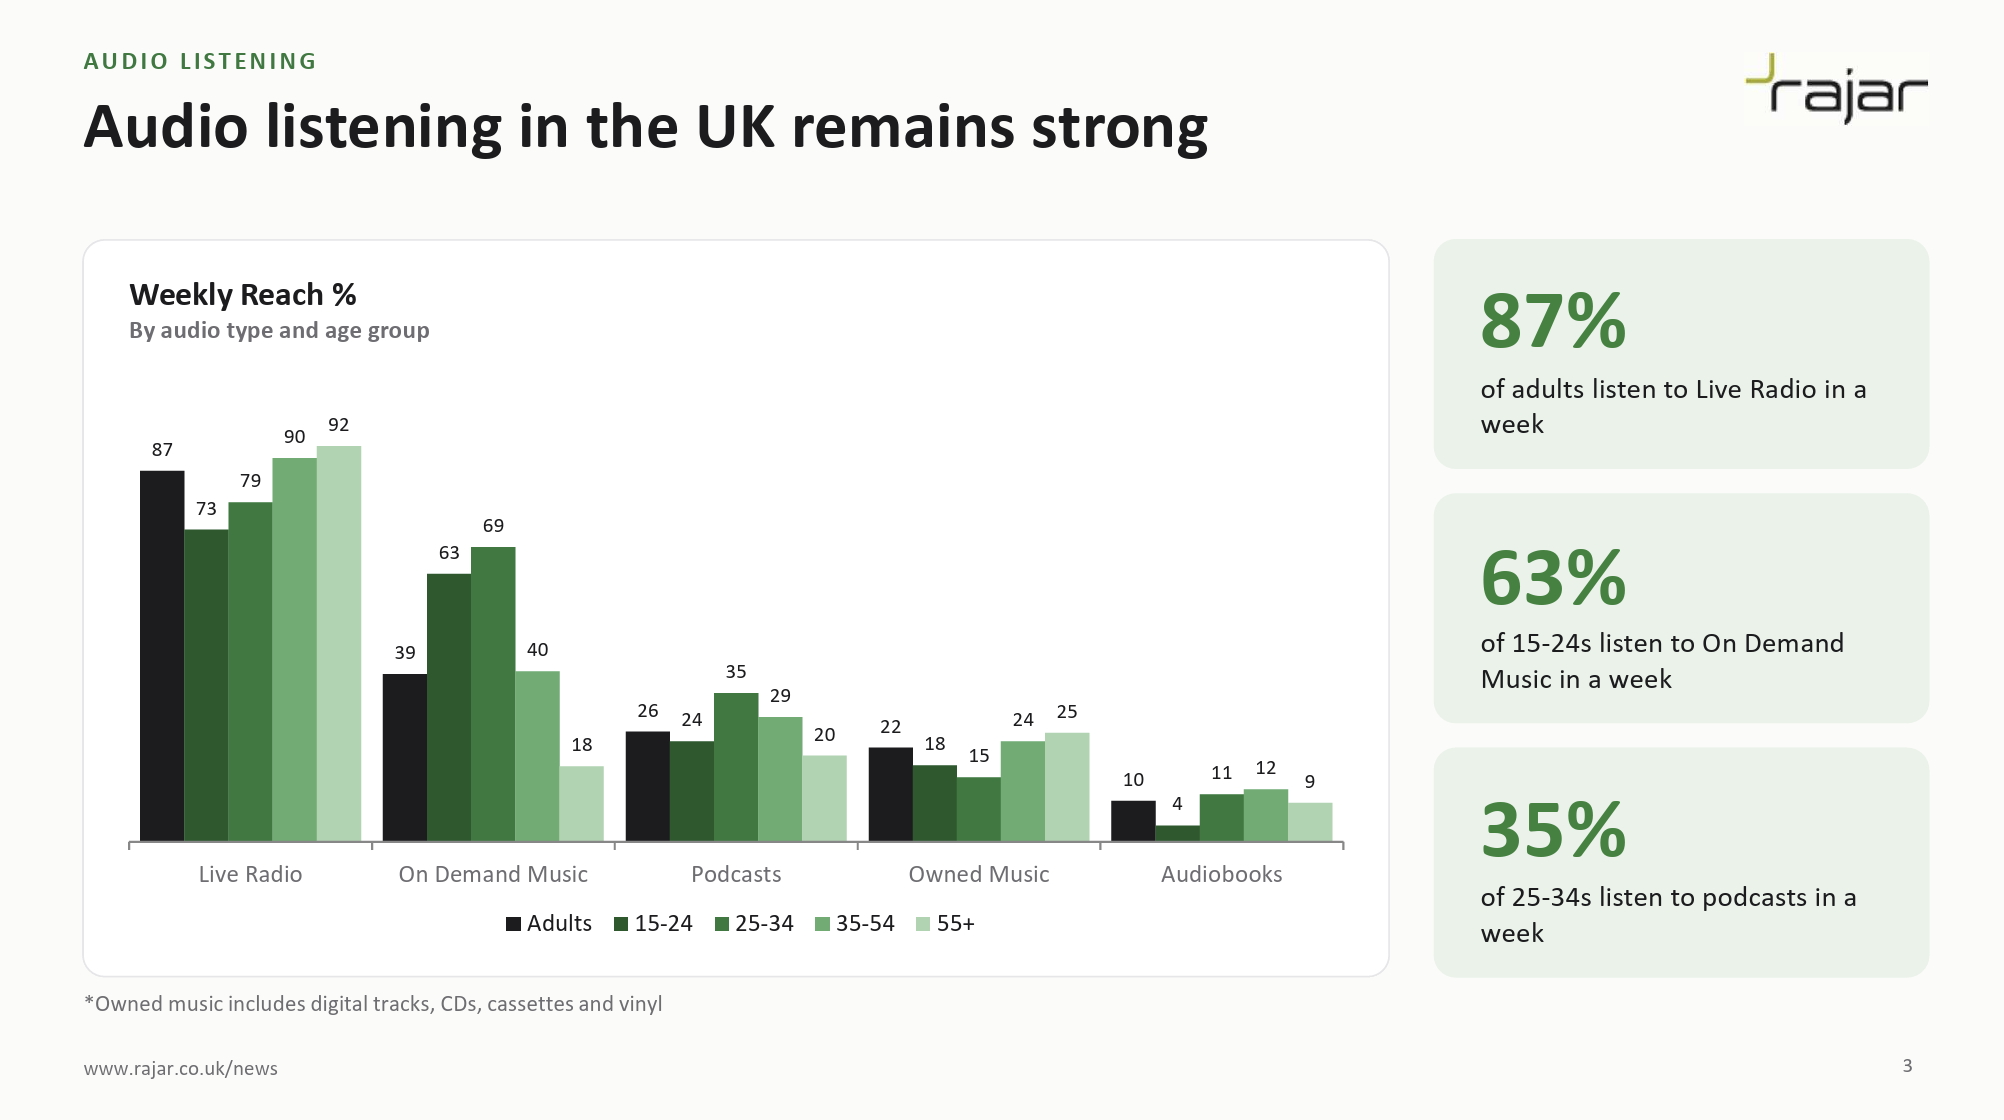
And if you look at reach, then radio looks pretty solid compared with On Demand Music (i.e. Spotify, Apple Music and others). Even if the closest age group, 79% of 25-34s listen to the radio compared with 69% of 25-34s using an On Demand Music service.
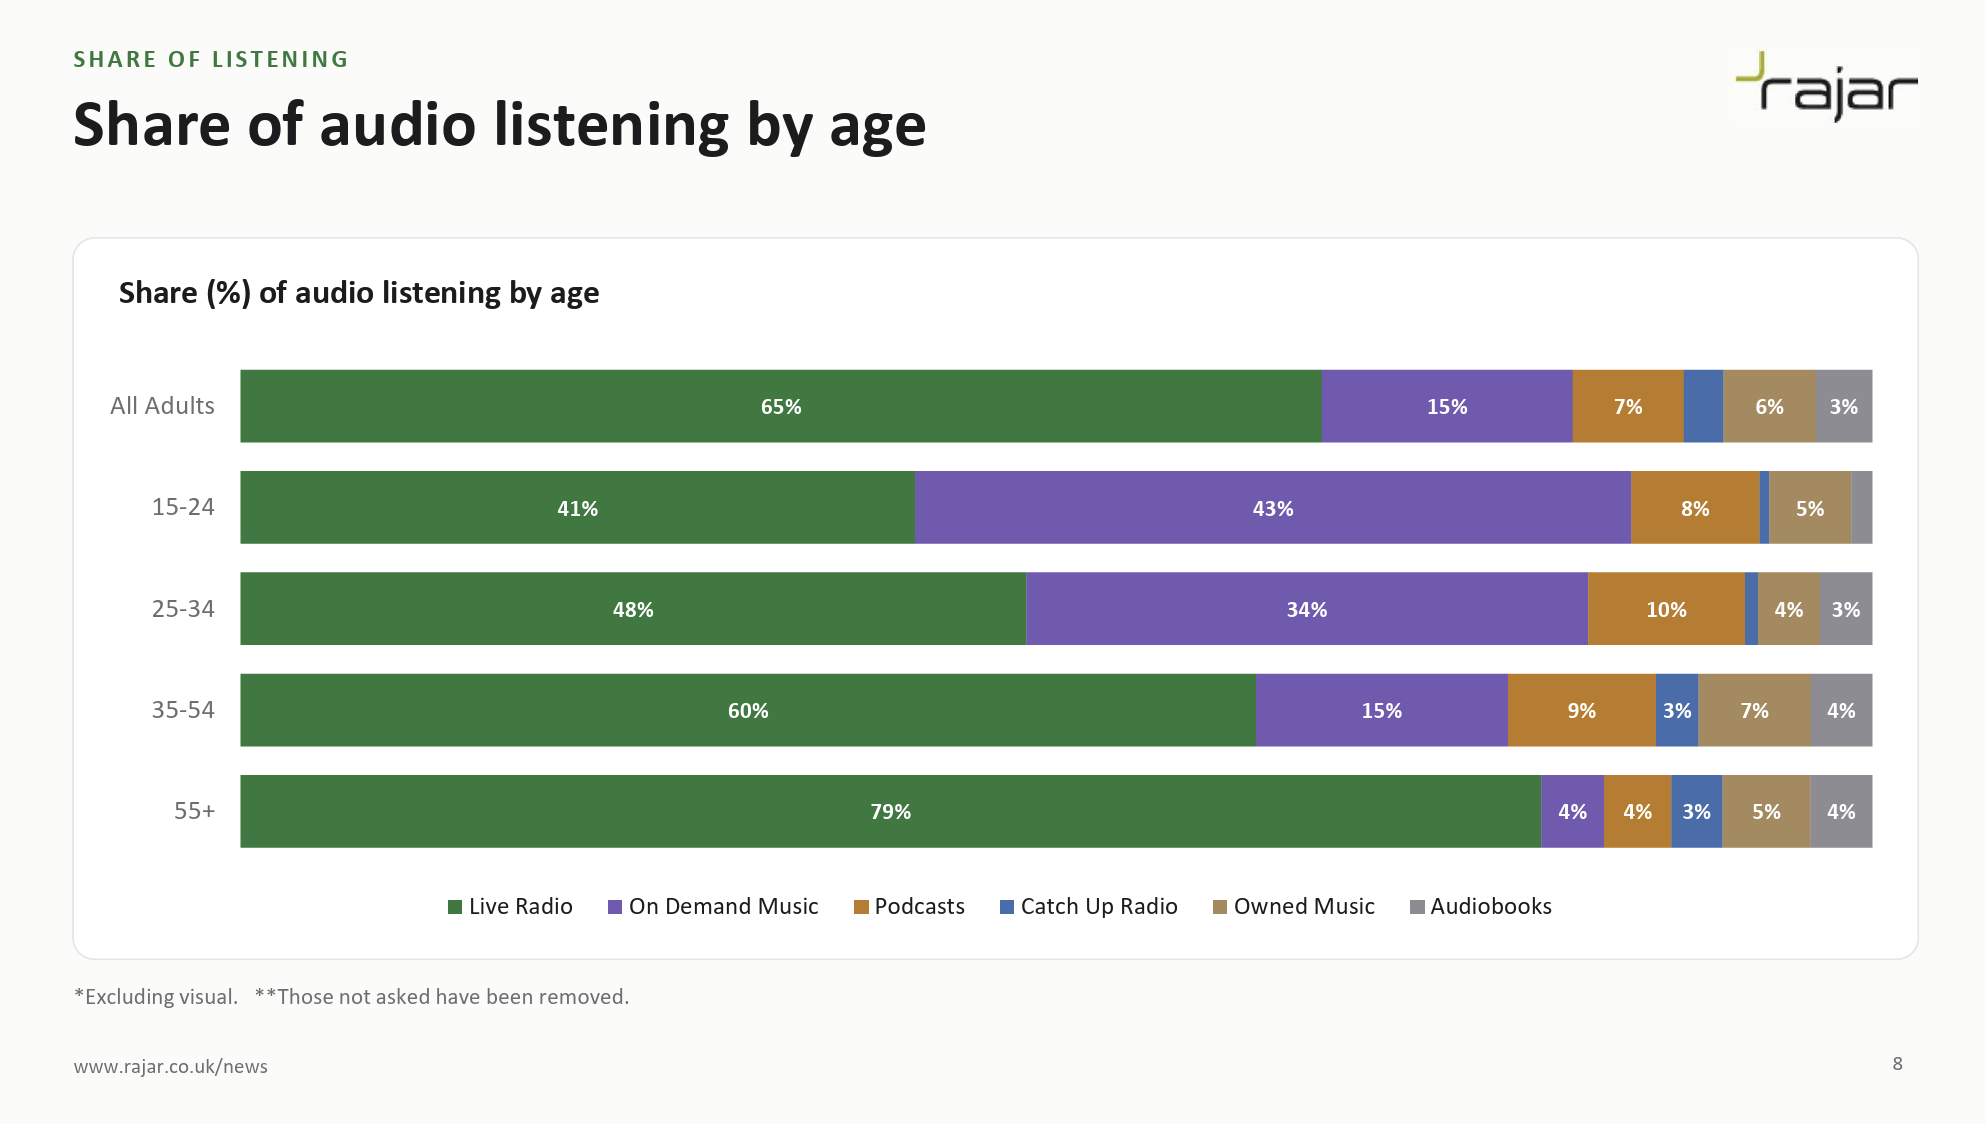
But if you look at the listening share, you can see that there is one age group, 15-24s, where the time spent listening is higher for On Demand Music services. They spend 43% of their audio listening to On Demand Music compared with just 41% of their audio listening to Radio.
If you look at the number in Matt’s trending tool, you can see that this has been the pattern for a while.
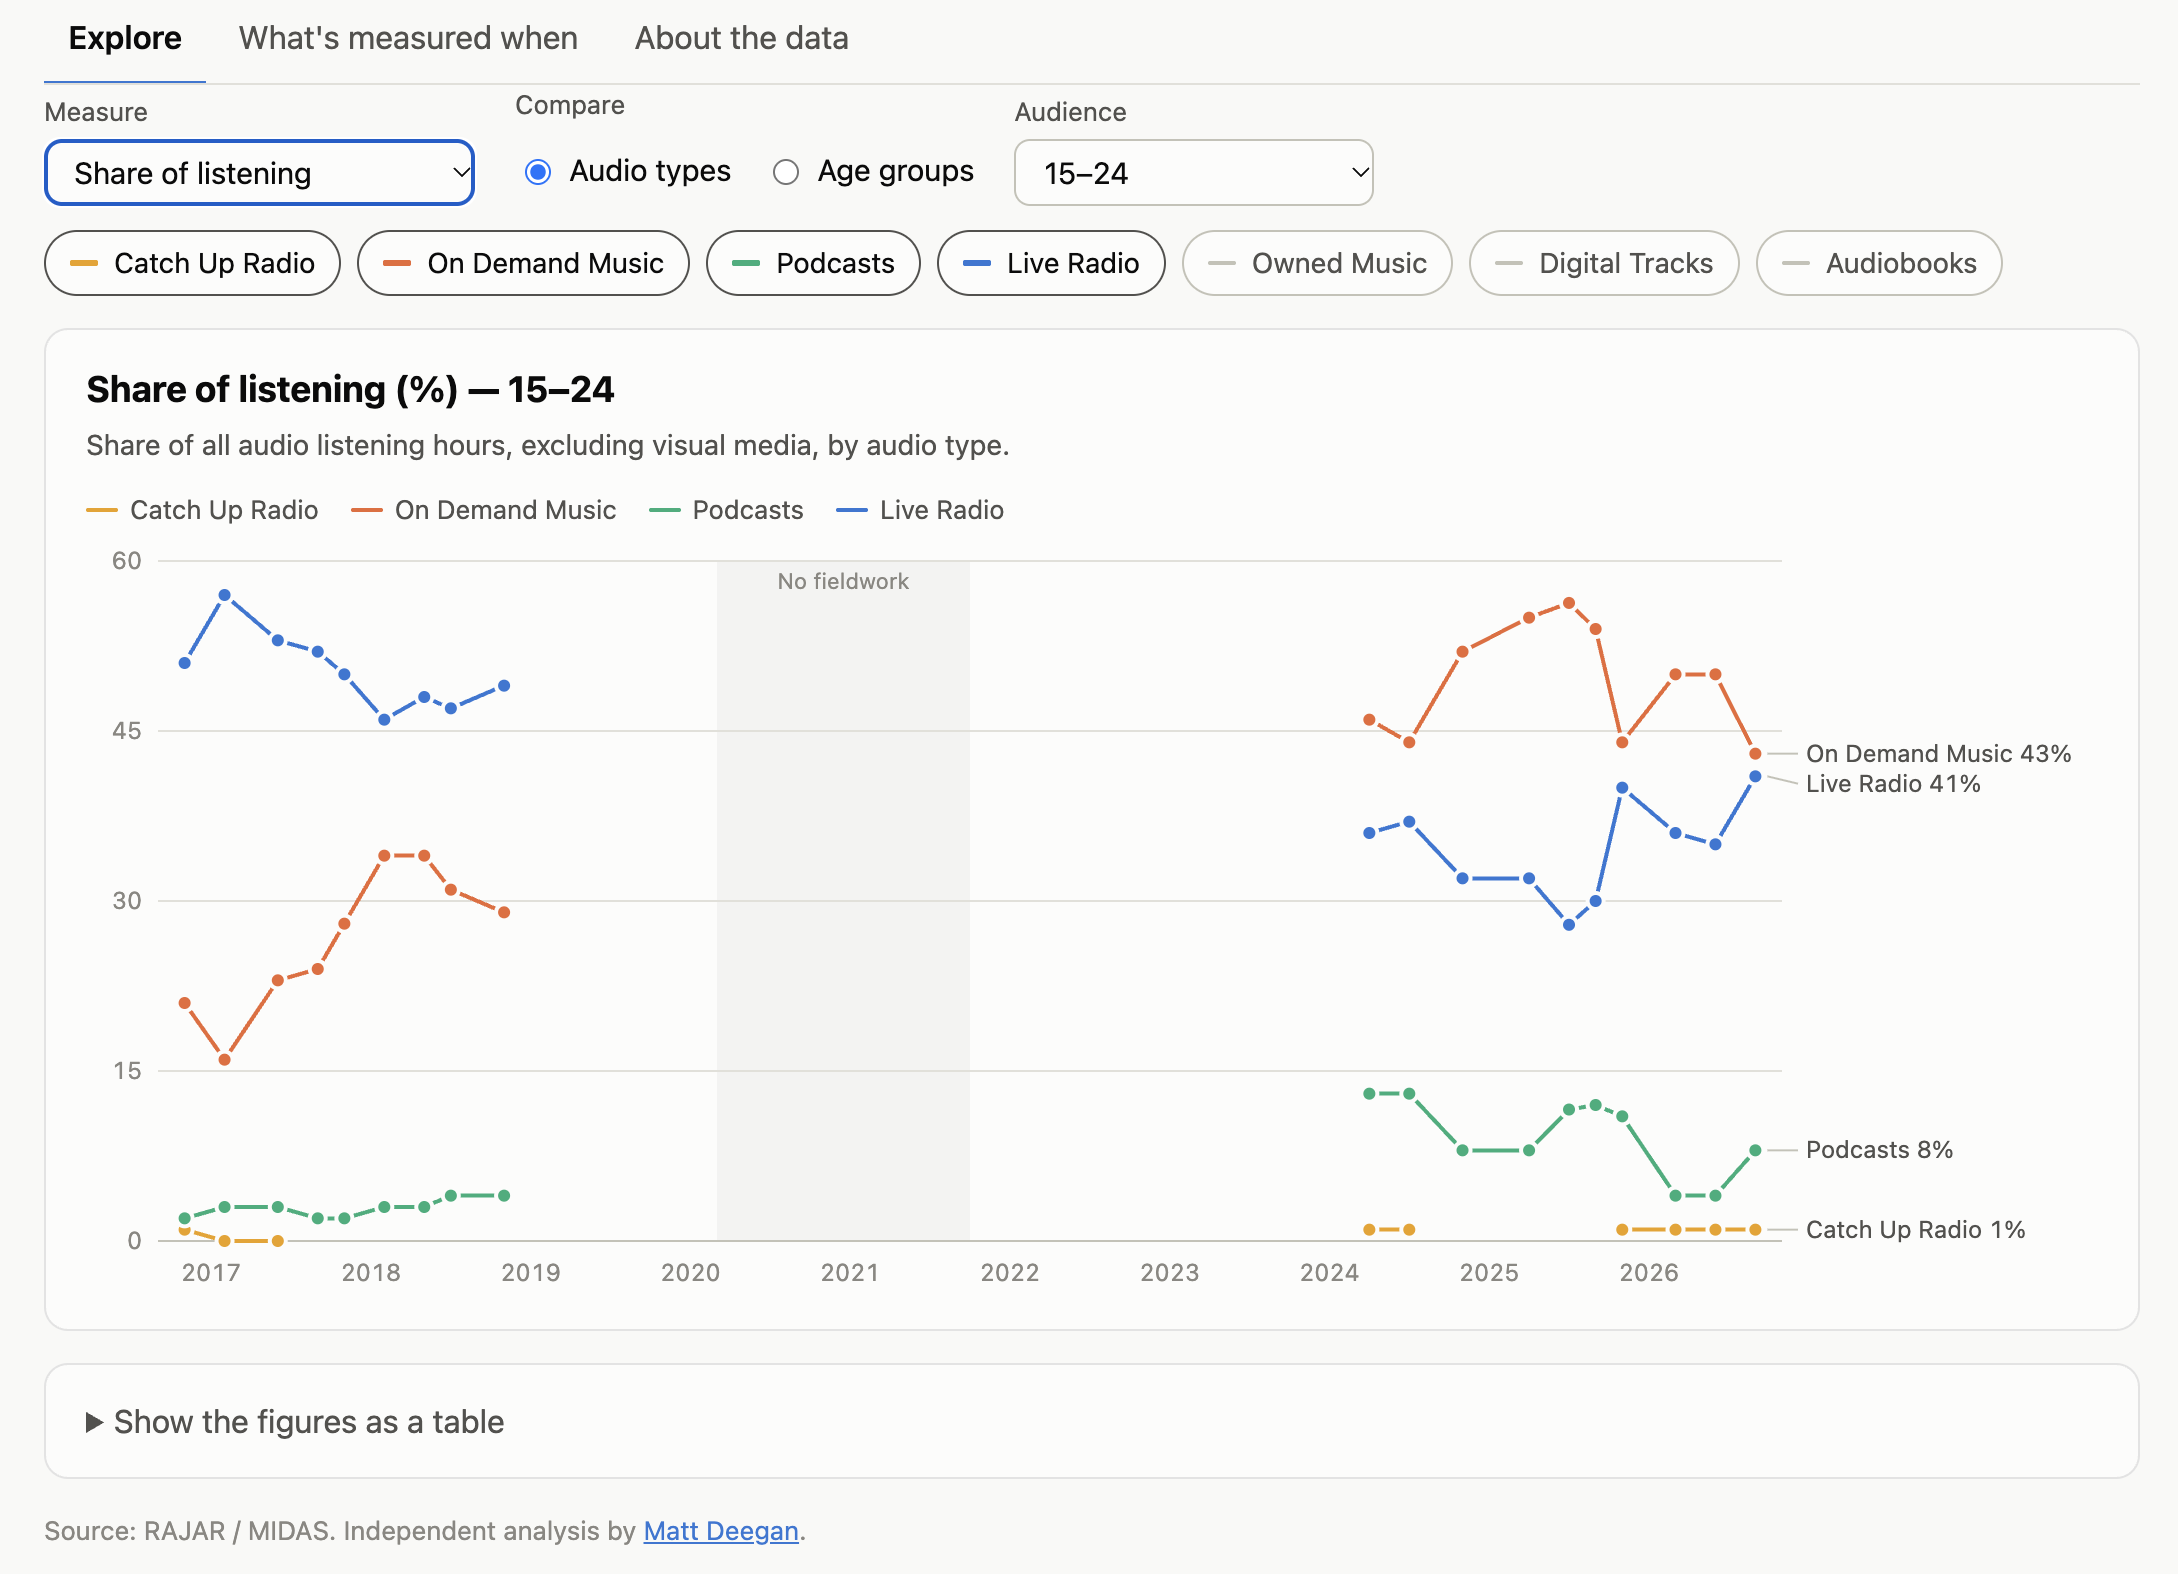
Note that there were no publicly shared numbers for the gap in the middle, but sometime post-COVID, Live Radio and On Demand Music flipped for this group. Although it should be noted that the gap has closed substantially this quarter.
For those specifically interested in Podcast reach, MIDAS reports it as 26%, where it has been for about a year at this point. Again, I should note that the methodology here is different to the regular RAJAR research methodology which recently started to include audio and video in its measurements. That survey put weekly podcast listening at 30.7%. However, Ofcom’s 2026 survey measured podcast listening at 25% earlier this year. This again uses a different methodology.
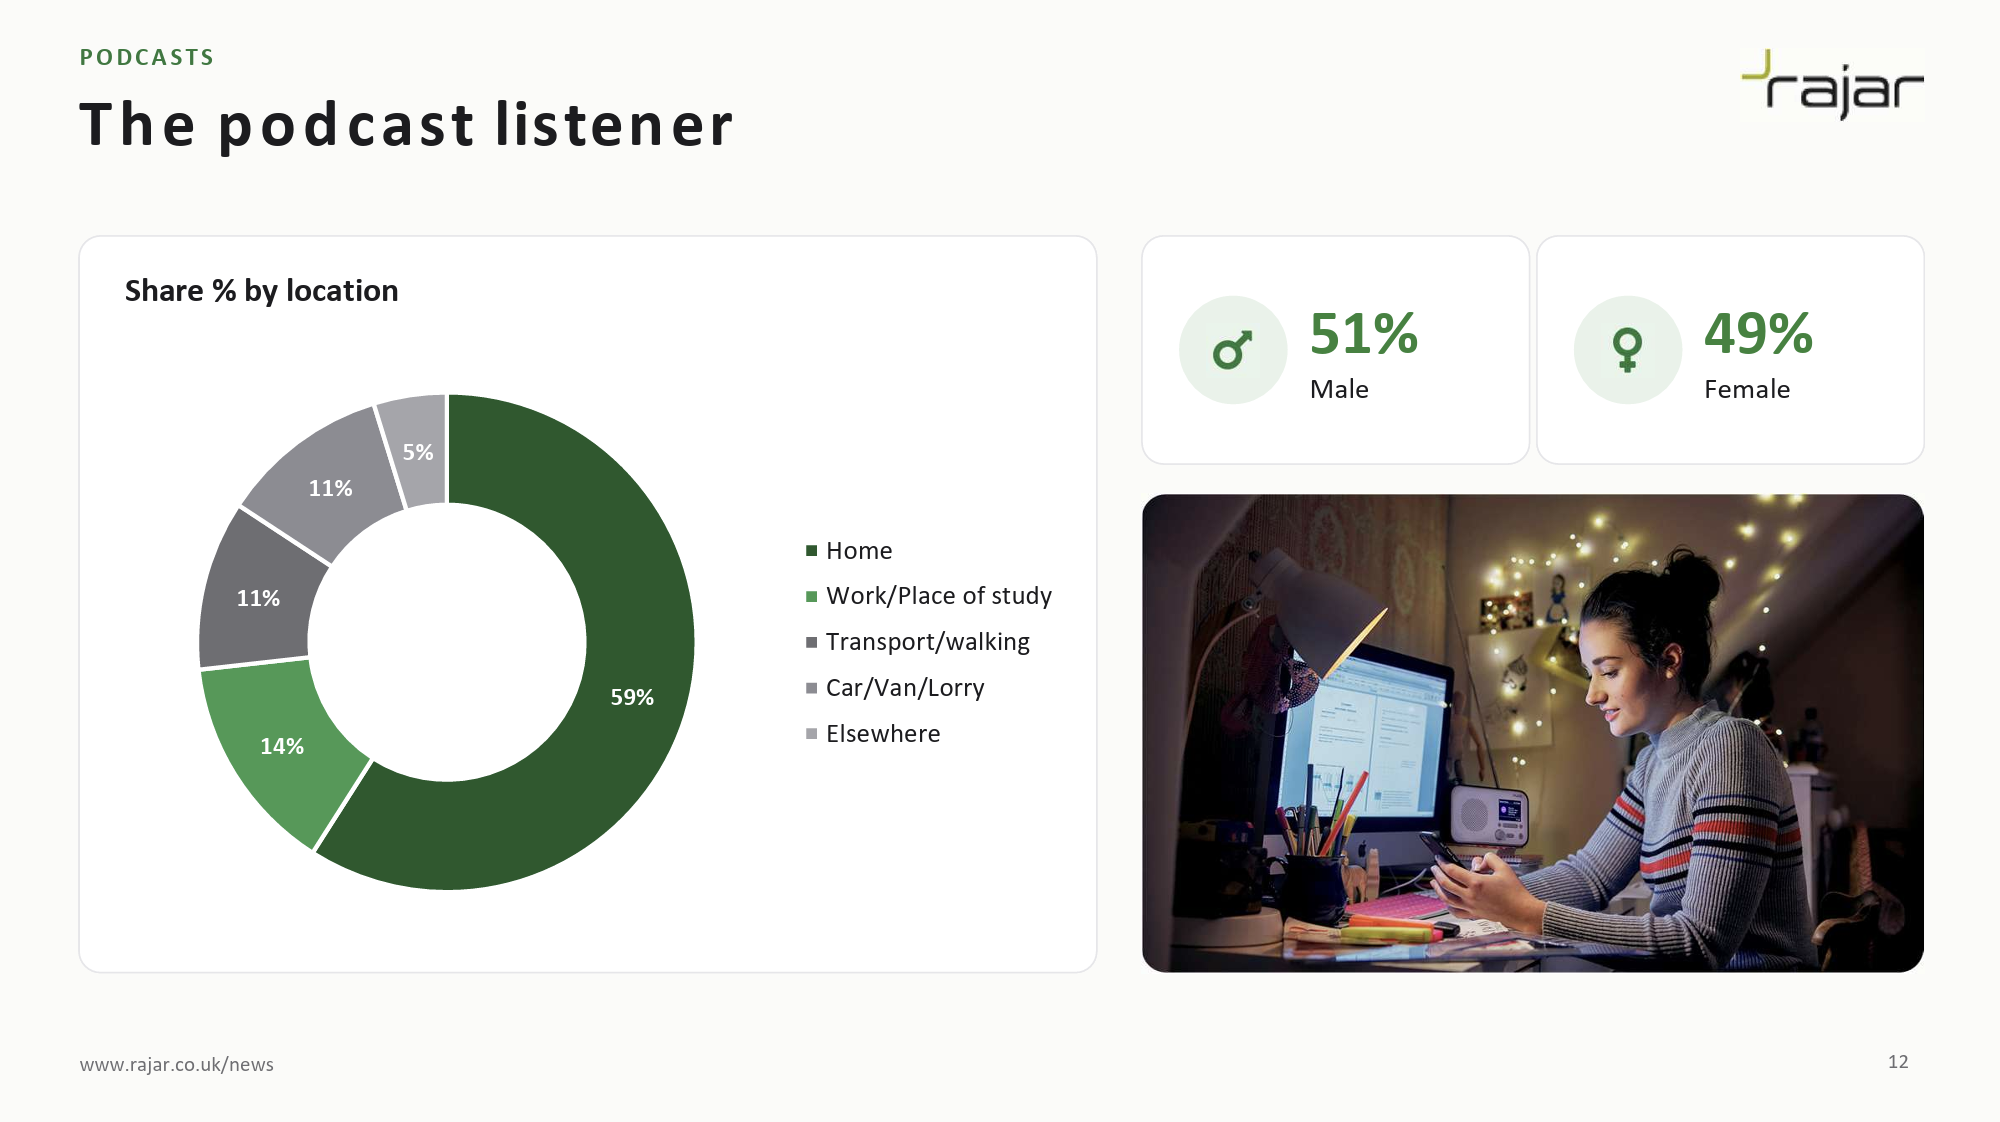
Podcast listeners are very evenly split between males and females, with most listening taking place at home. A surprisingly small amount of listening – just 11% – happens in the car. Compare this with 25% of listening to radio taking place in car according to RAJAR Q3 2026.
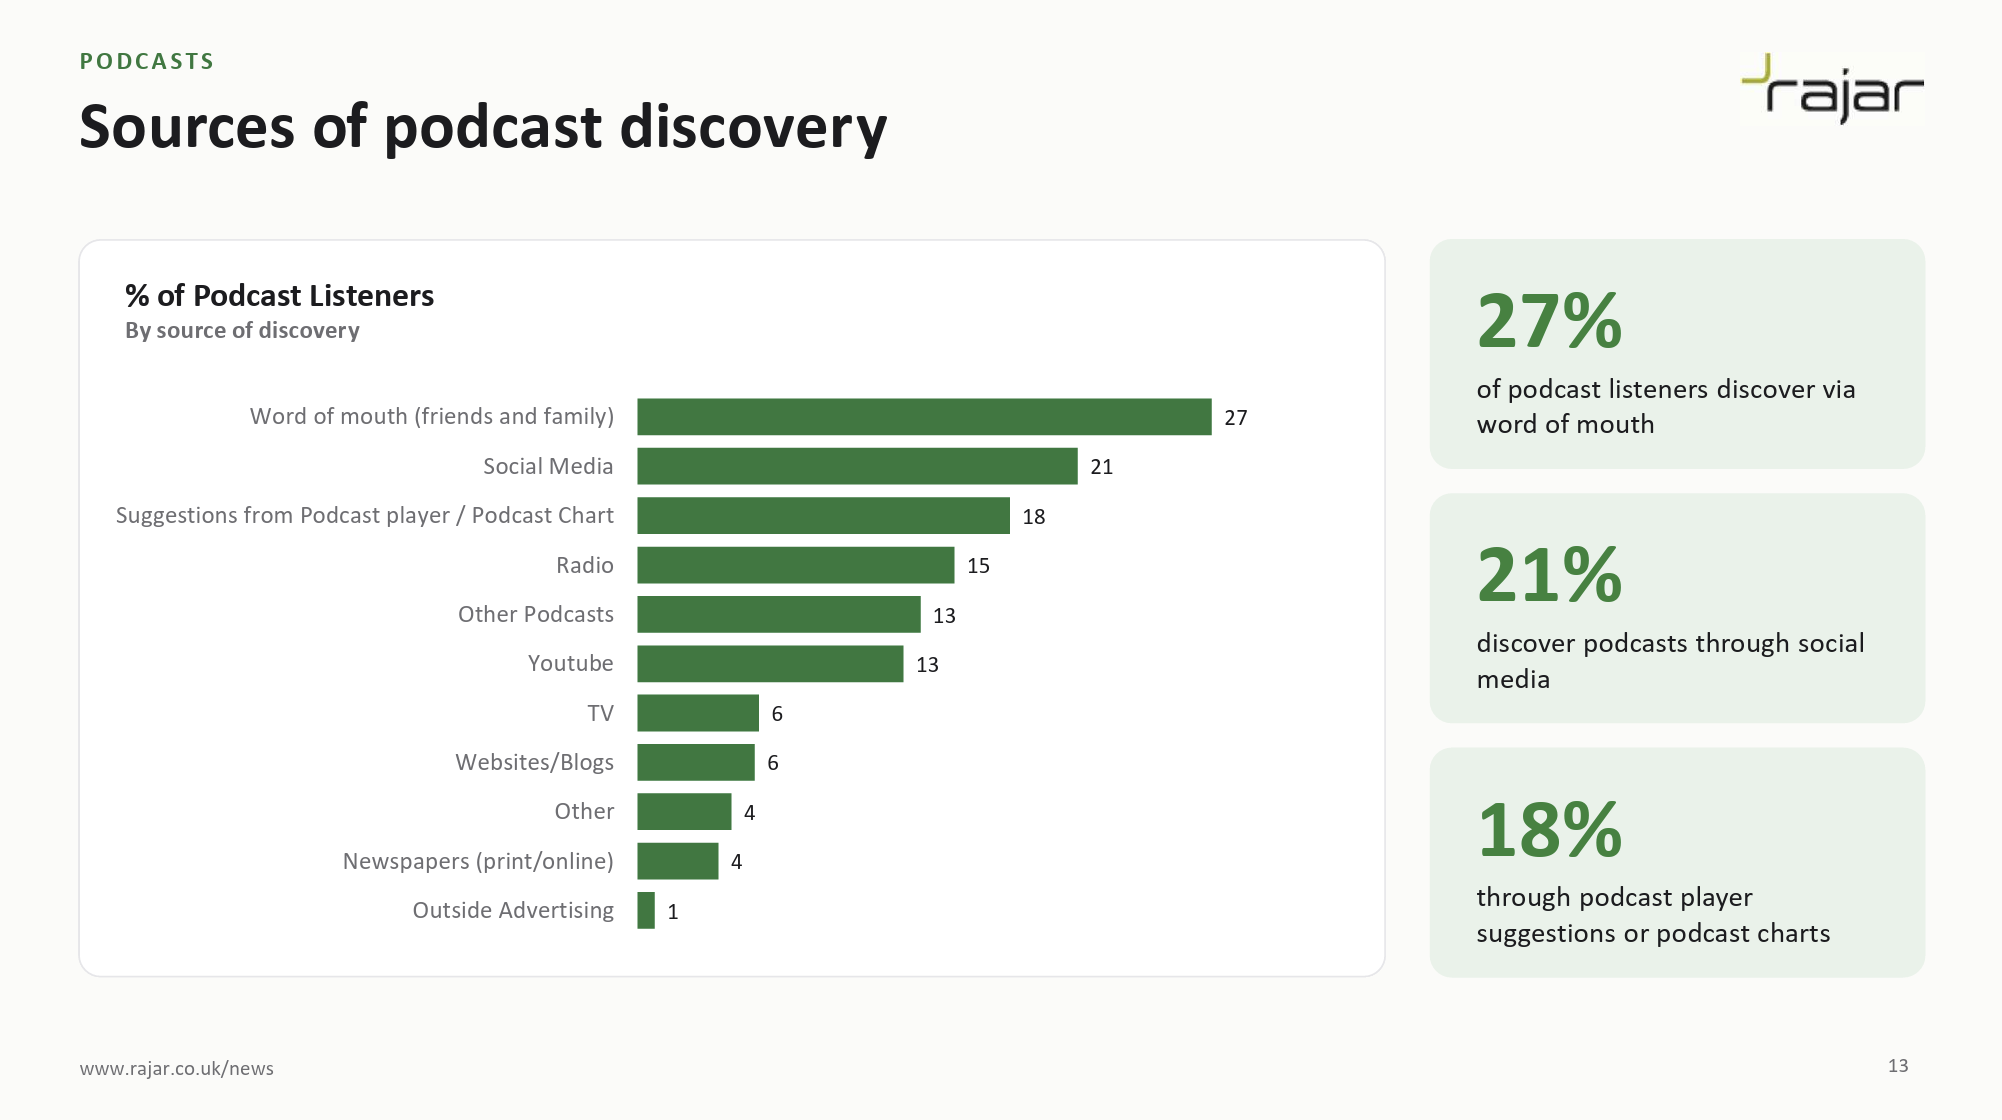
Word of mouth continues to be the way most people discover podcasts, followed by social media. Interestingly, suggestions from your player or a chart come third, which I think shows the power of the algorithms within these platforms. While in the past, a lot of these suggestions were “hand crafted” by editorial teams, increasingly we’re seeing algorithms take over this role.
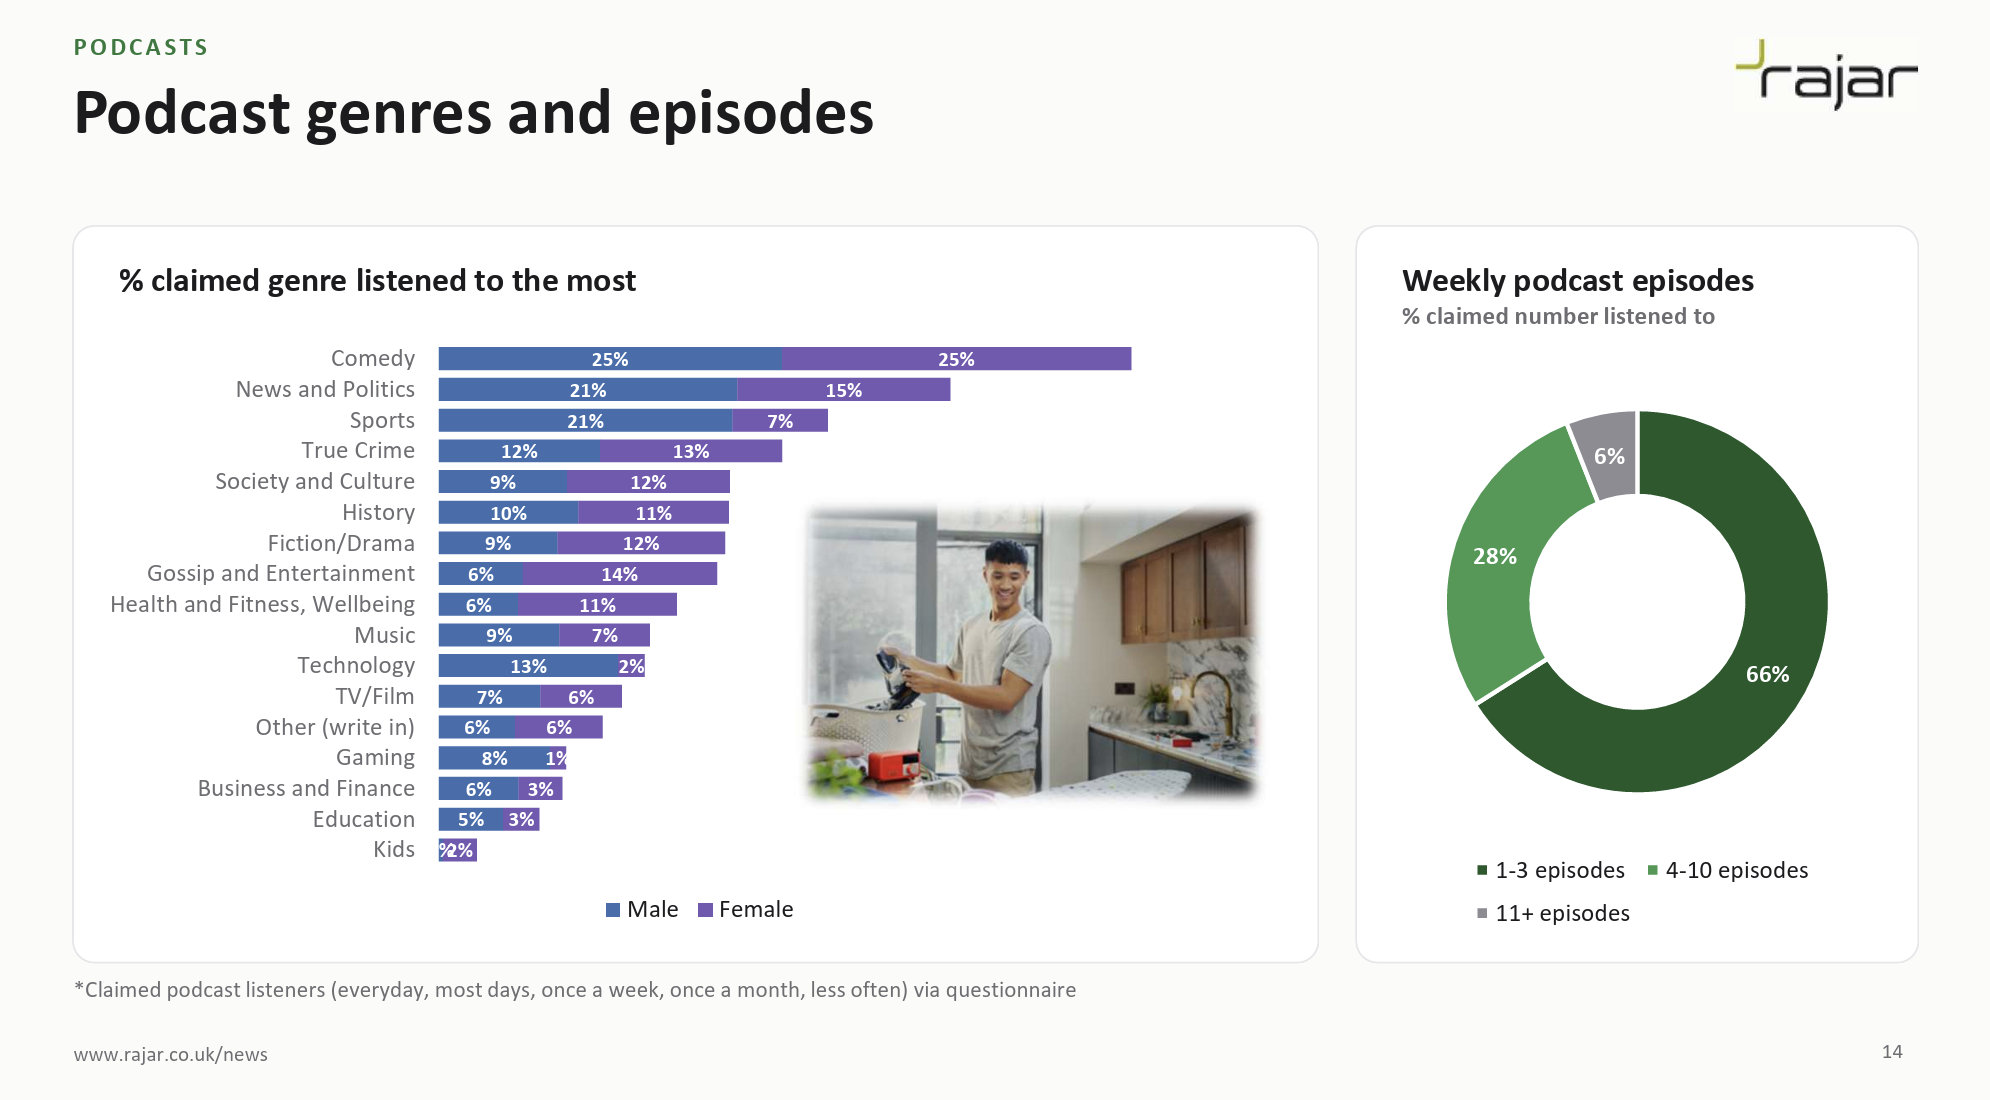
Comedy and News & Politics are the biggest categories, and most people listen to 3 or fewer podcast episodes a week. Only 6% of podcast listeners hear 11 or more episodes a week. This is always a reminder that people have limited capacity for your new 1 hour+ podcast!
Finally in this section, I always find the listening-through-the-day chart really fascinating.
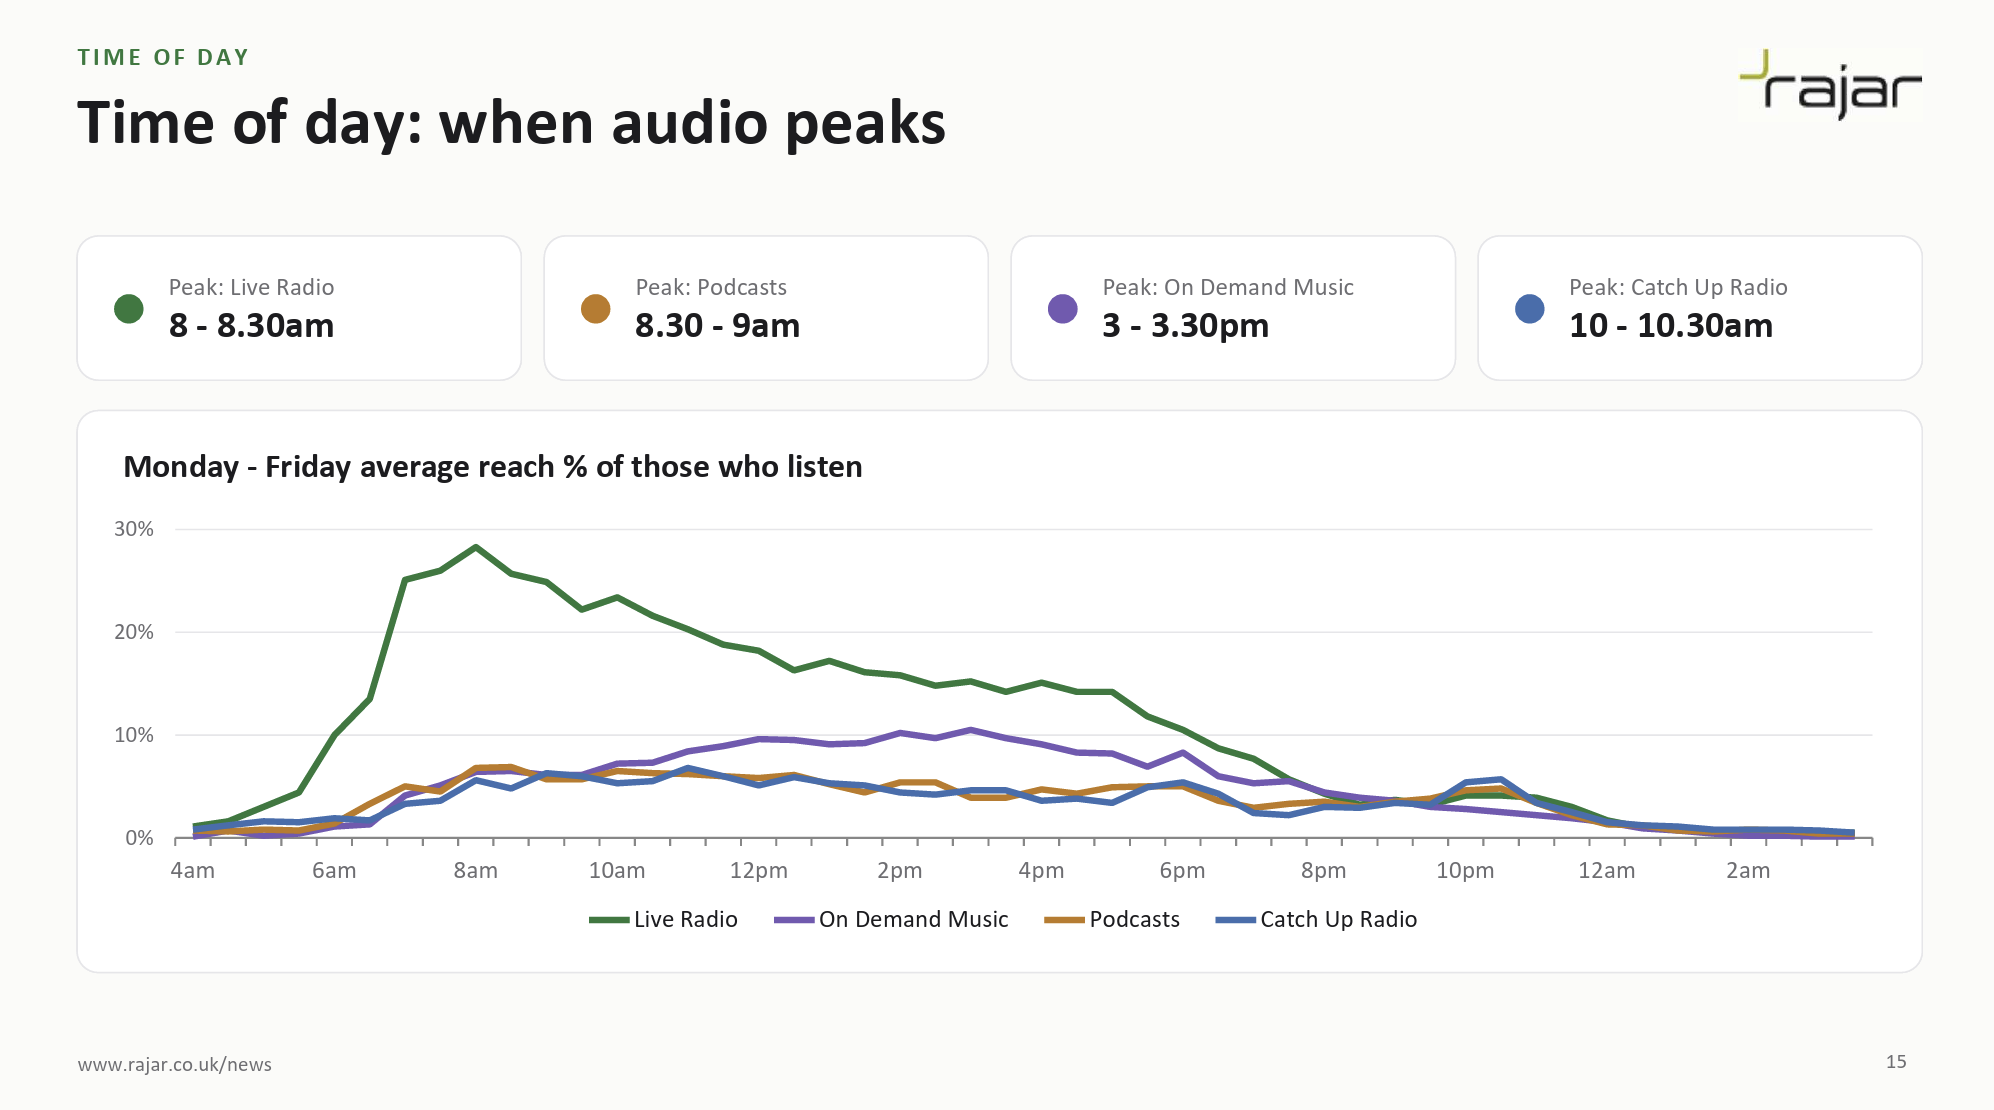
Radio is still dominant at 8.00am in the morning, although it’s notable that podcast listening peaks at 8.30am. Podcast listening is relatively consistent through the day however. On Demand Music listening grows through the afternoon, peaking at around 3.00pm before slipping away at night. A lot of audio gets a little bump at around 10.30pm when perhaps people drift away from their TVs and wind down for the evening.
One thing that wasn’t mentioned with respect to podcast listening in this research was video podcast listening.
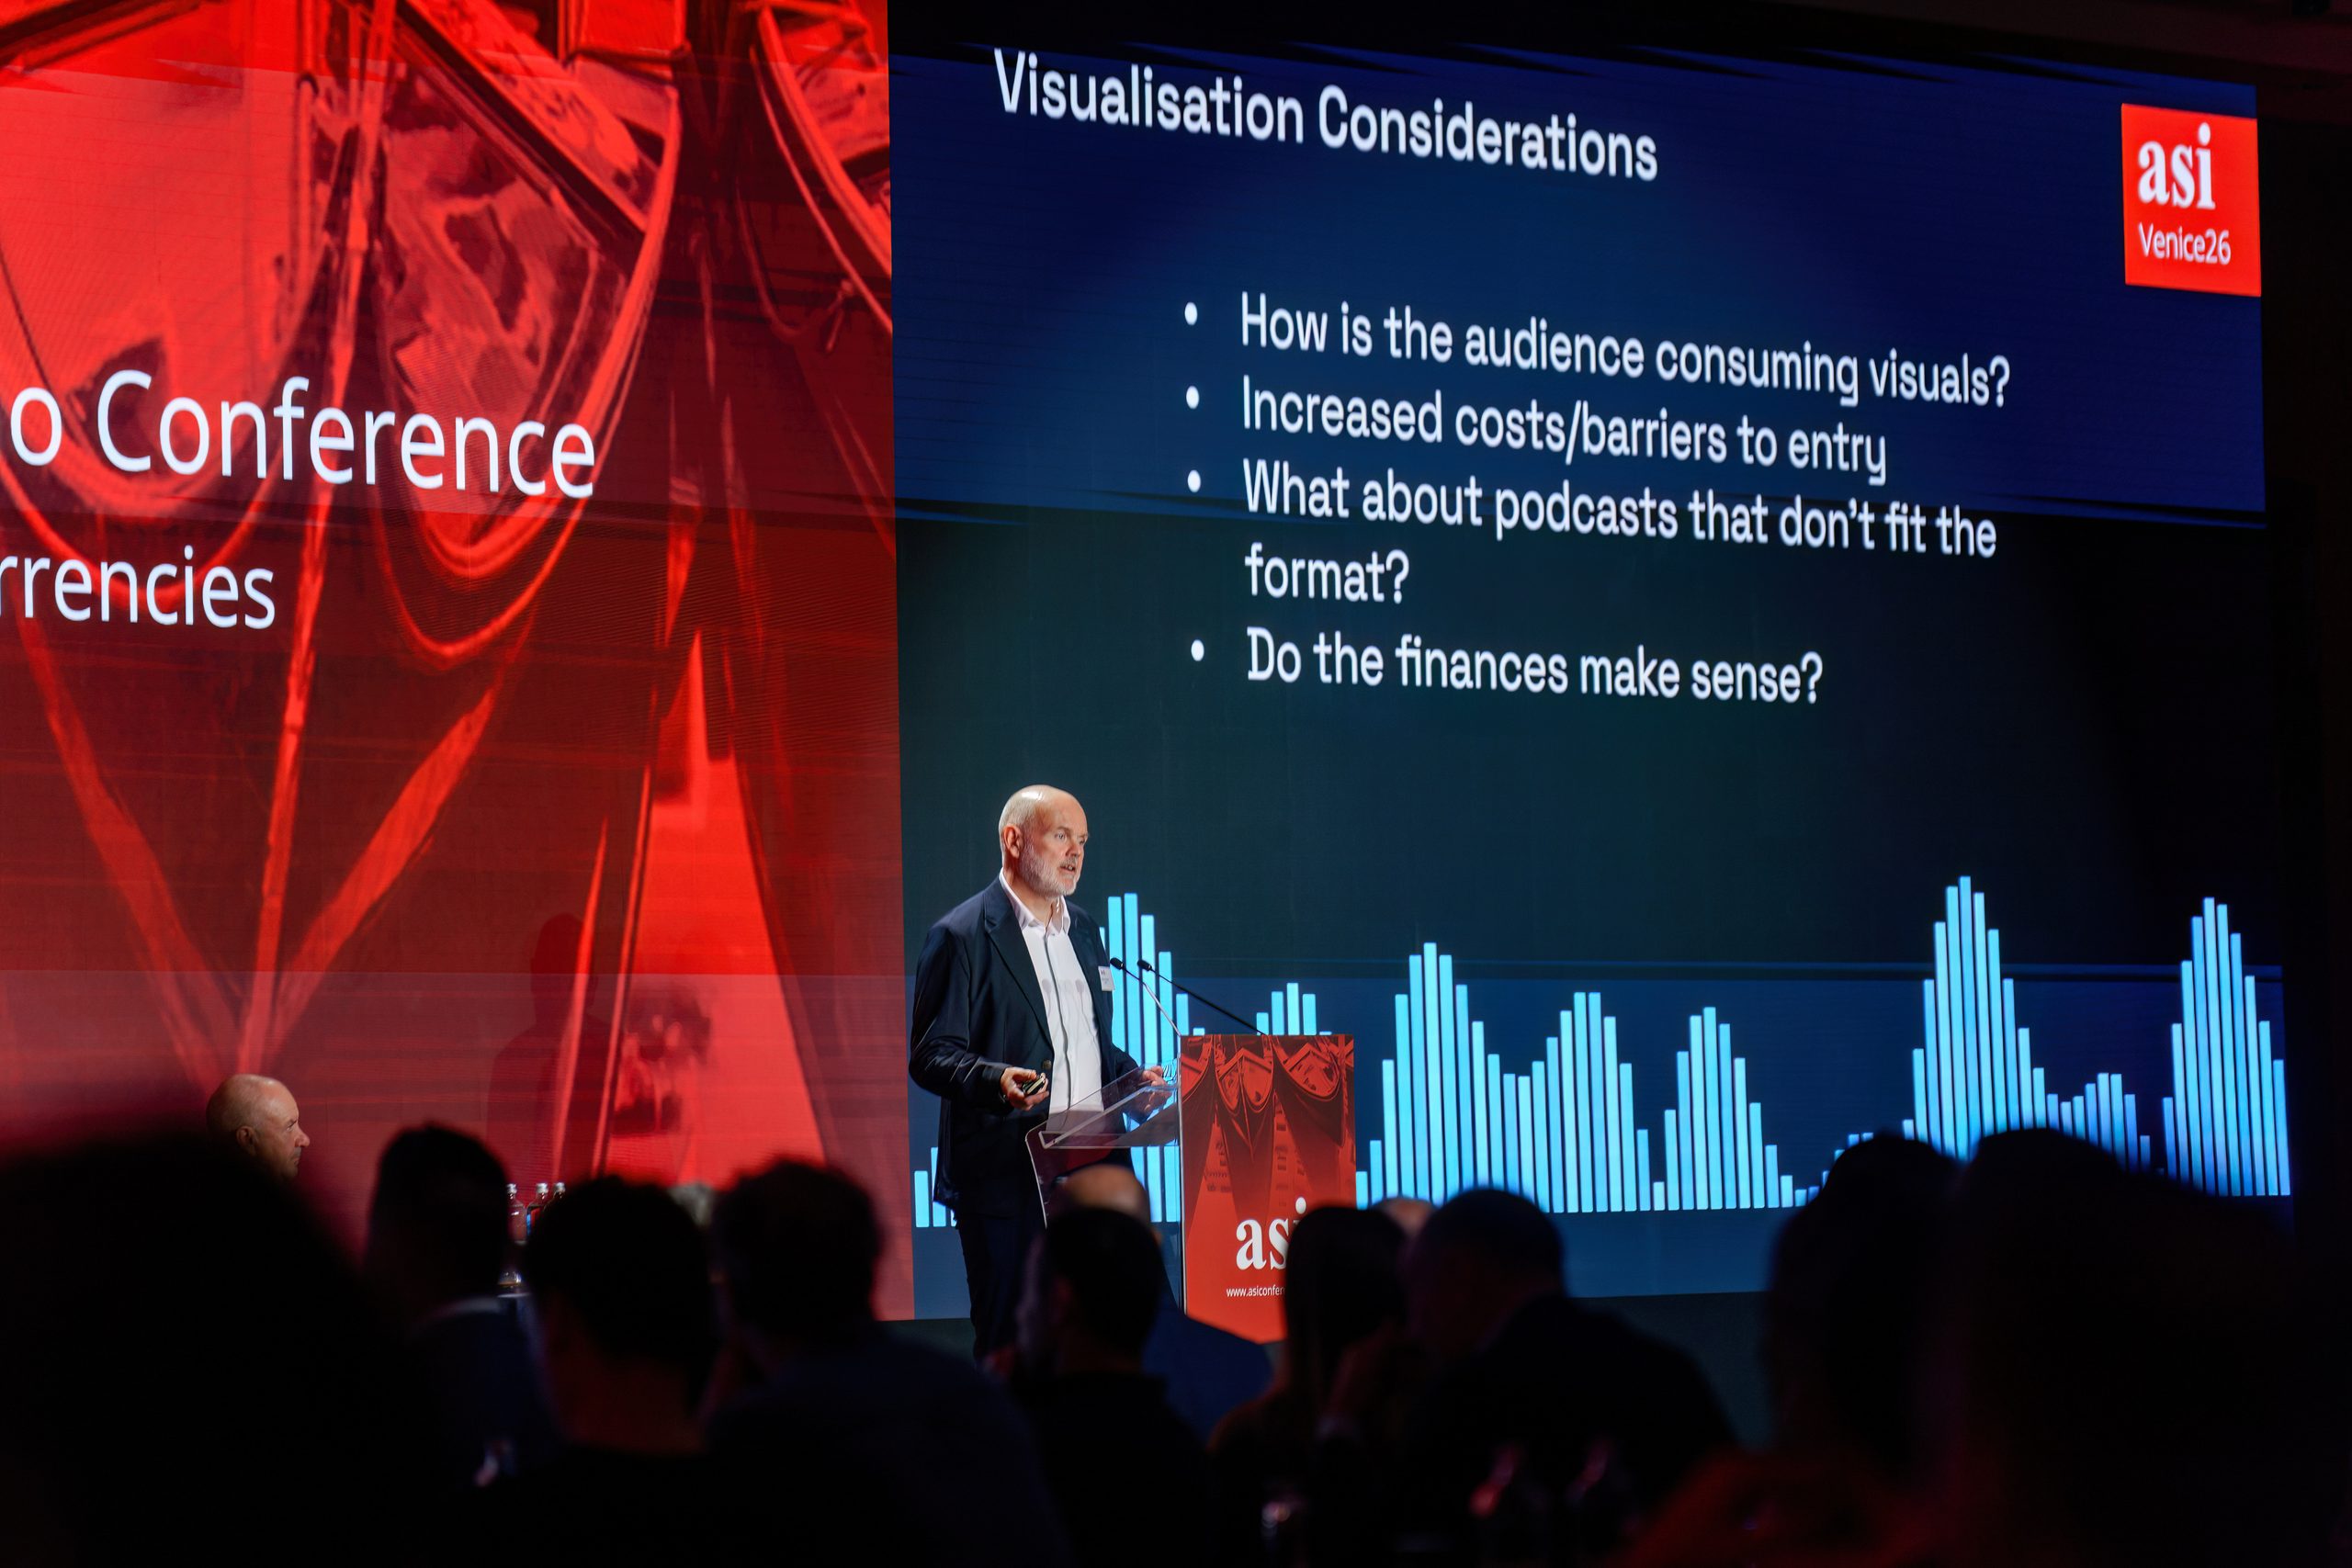
At the ASI audio conference in Venice last week, I delivered a talk entitled The Future of Audio. I’ll share my full presentation here in due course, but one of my questions posed in my keynote was whether we knew how audiences were consuming visualised podcasts.
To be clear, visualising podcasts, or making video podcasts is almost critical these days. The discovery opportunities on a platform like YouTube or sharing clips on Instagram or TikTok, make it essential that you have some kind of video assets. And younger audiences have come to expect that podcasts come with visuals.
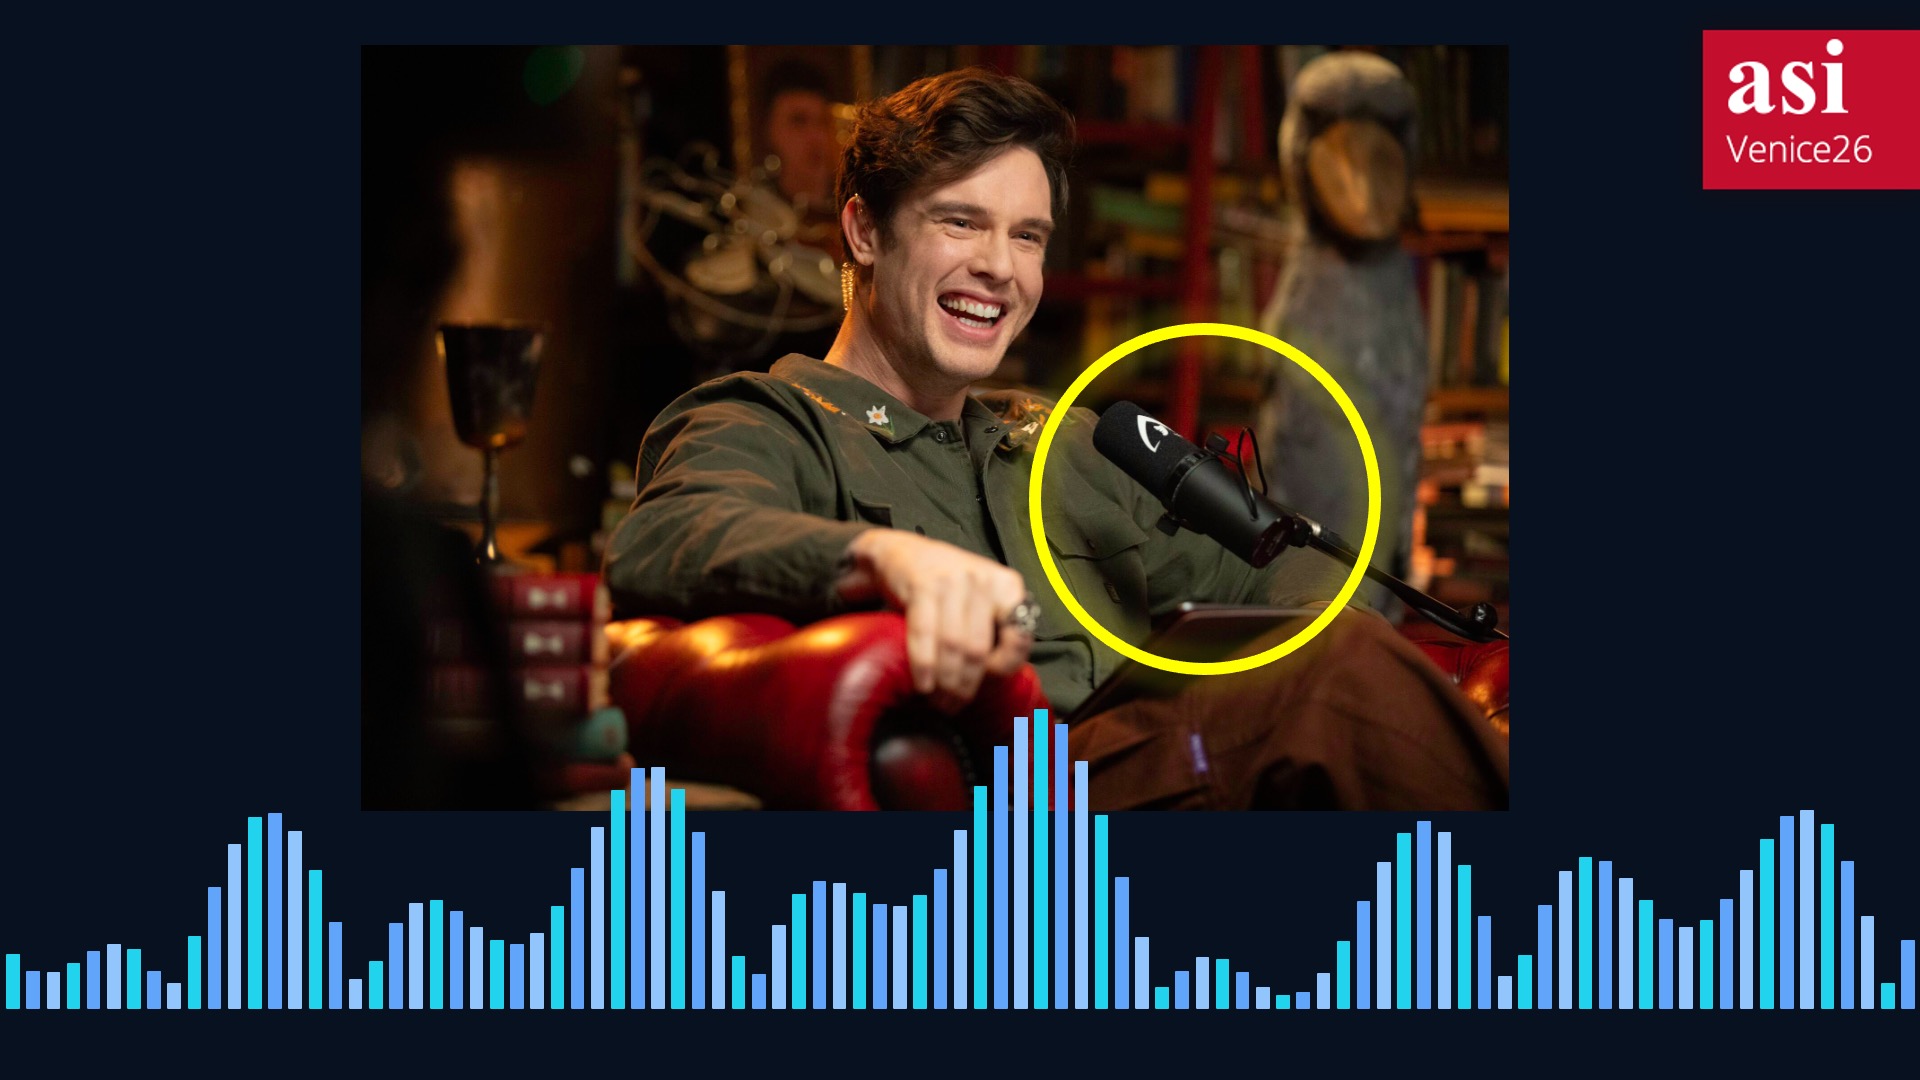
I noted that Celebrity Traitors: Uncloaked, was a programme that went out on primetime BBC1 right after the biggest show of the year, was filmed in a studio with a full production suite, and yet somehow calls itself a “podcast.” Really, because the Shure SM7B microphones they use are fully in frame. Lavalier microphones that attach to clothes might just as easily been used, but it’s now a style thing, and nothing screams “podcast” more than a microphone on a mic stand.
RAJAR has conducted some research into this very subject. The research was carried out with a sample who contribute to RAJAR’s monthly Podcast Tracker. This is not currently public, with RAJAR having stepped in to run a survey previously commissioned for the BBC. Only subscribers (BBC, Commercial Radio) have access to this data. But RAJAR has the ability to ask additional questions, and they asked about formats. John Carroll, Director of Research and Audiences at RAJAR presented some of these findings at the ASI conference last week.
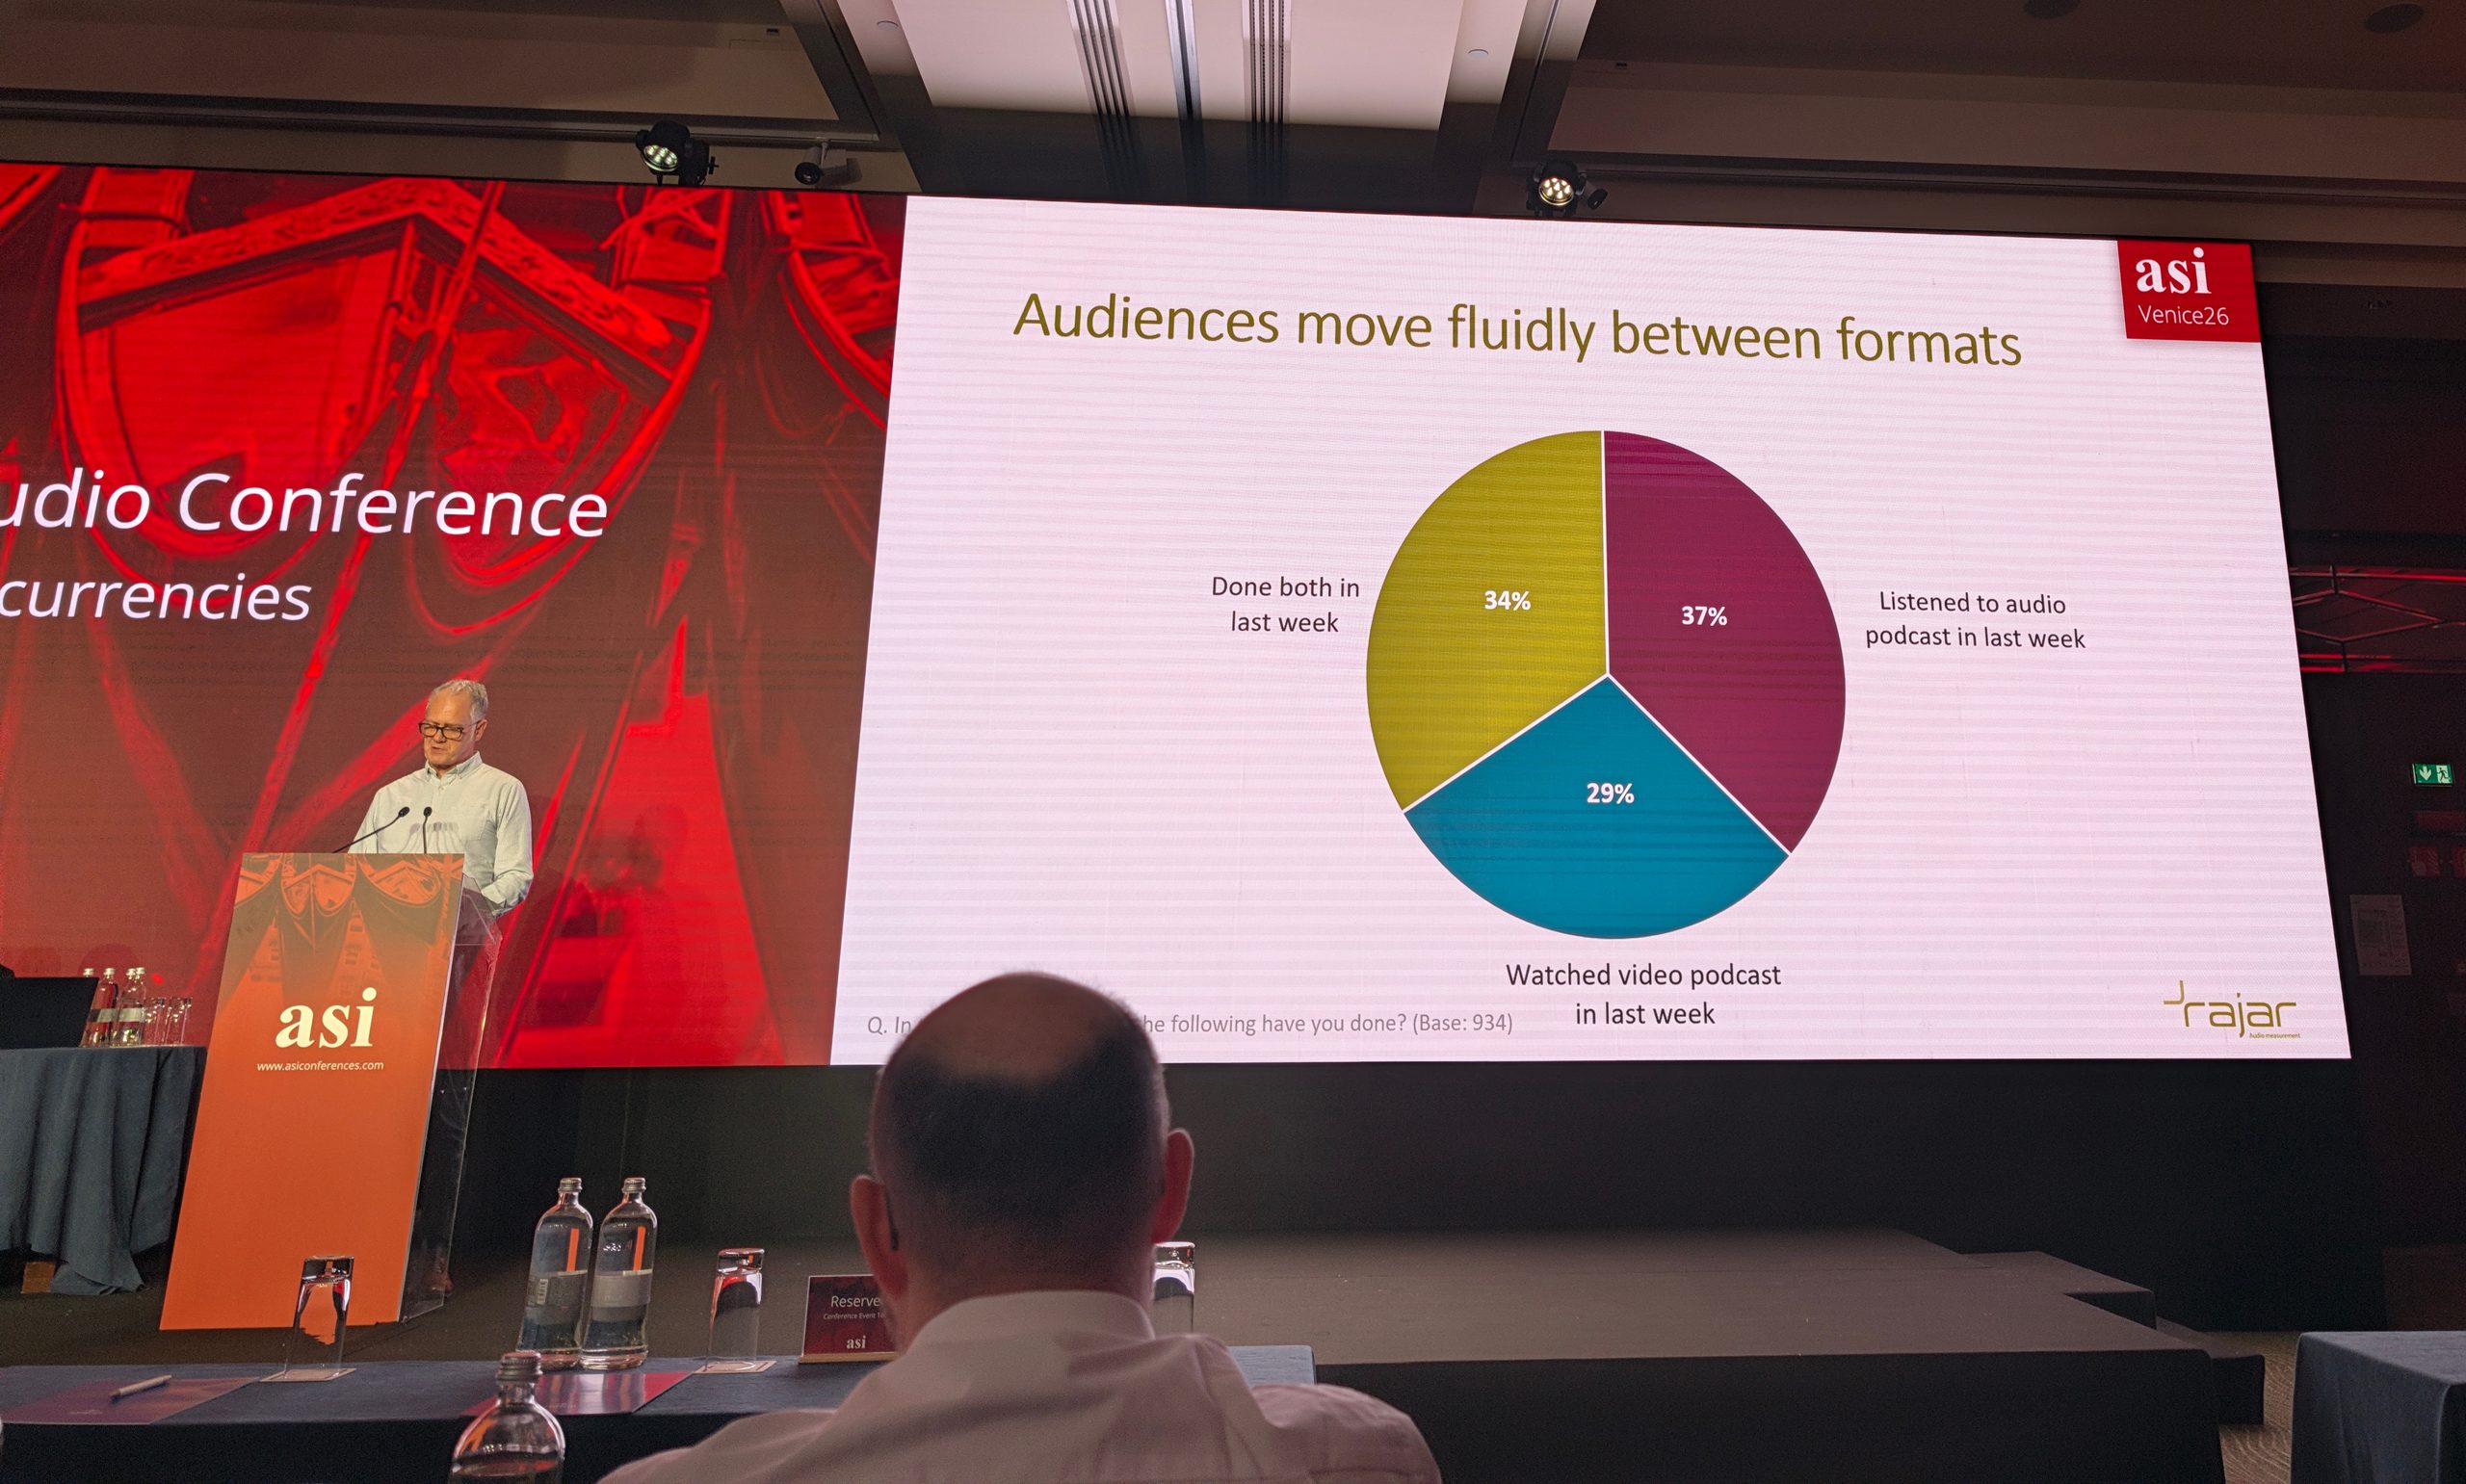
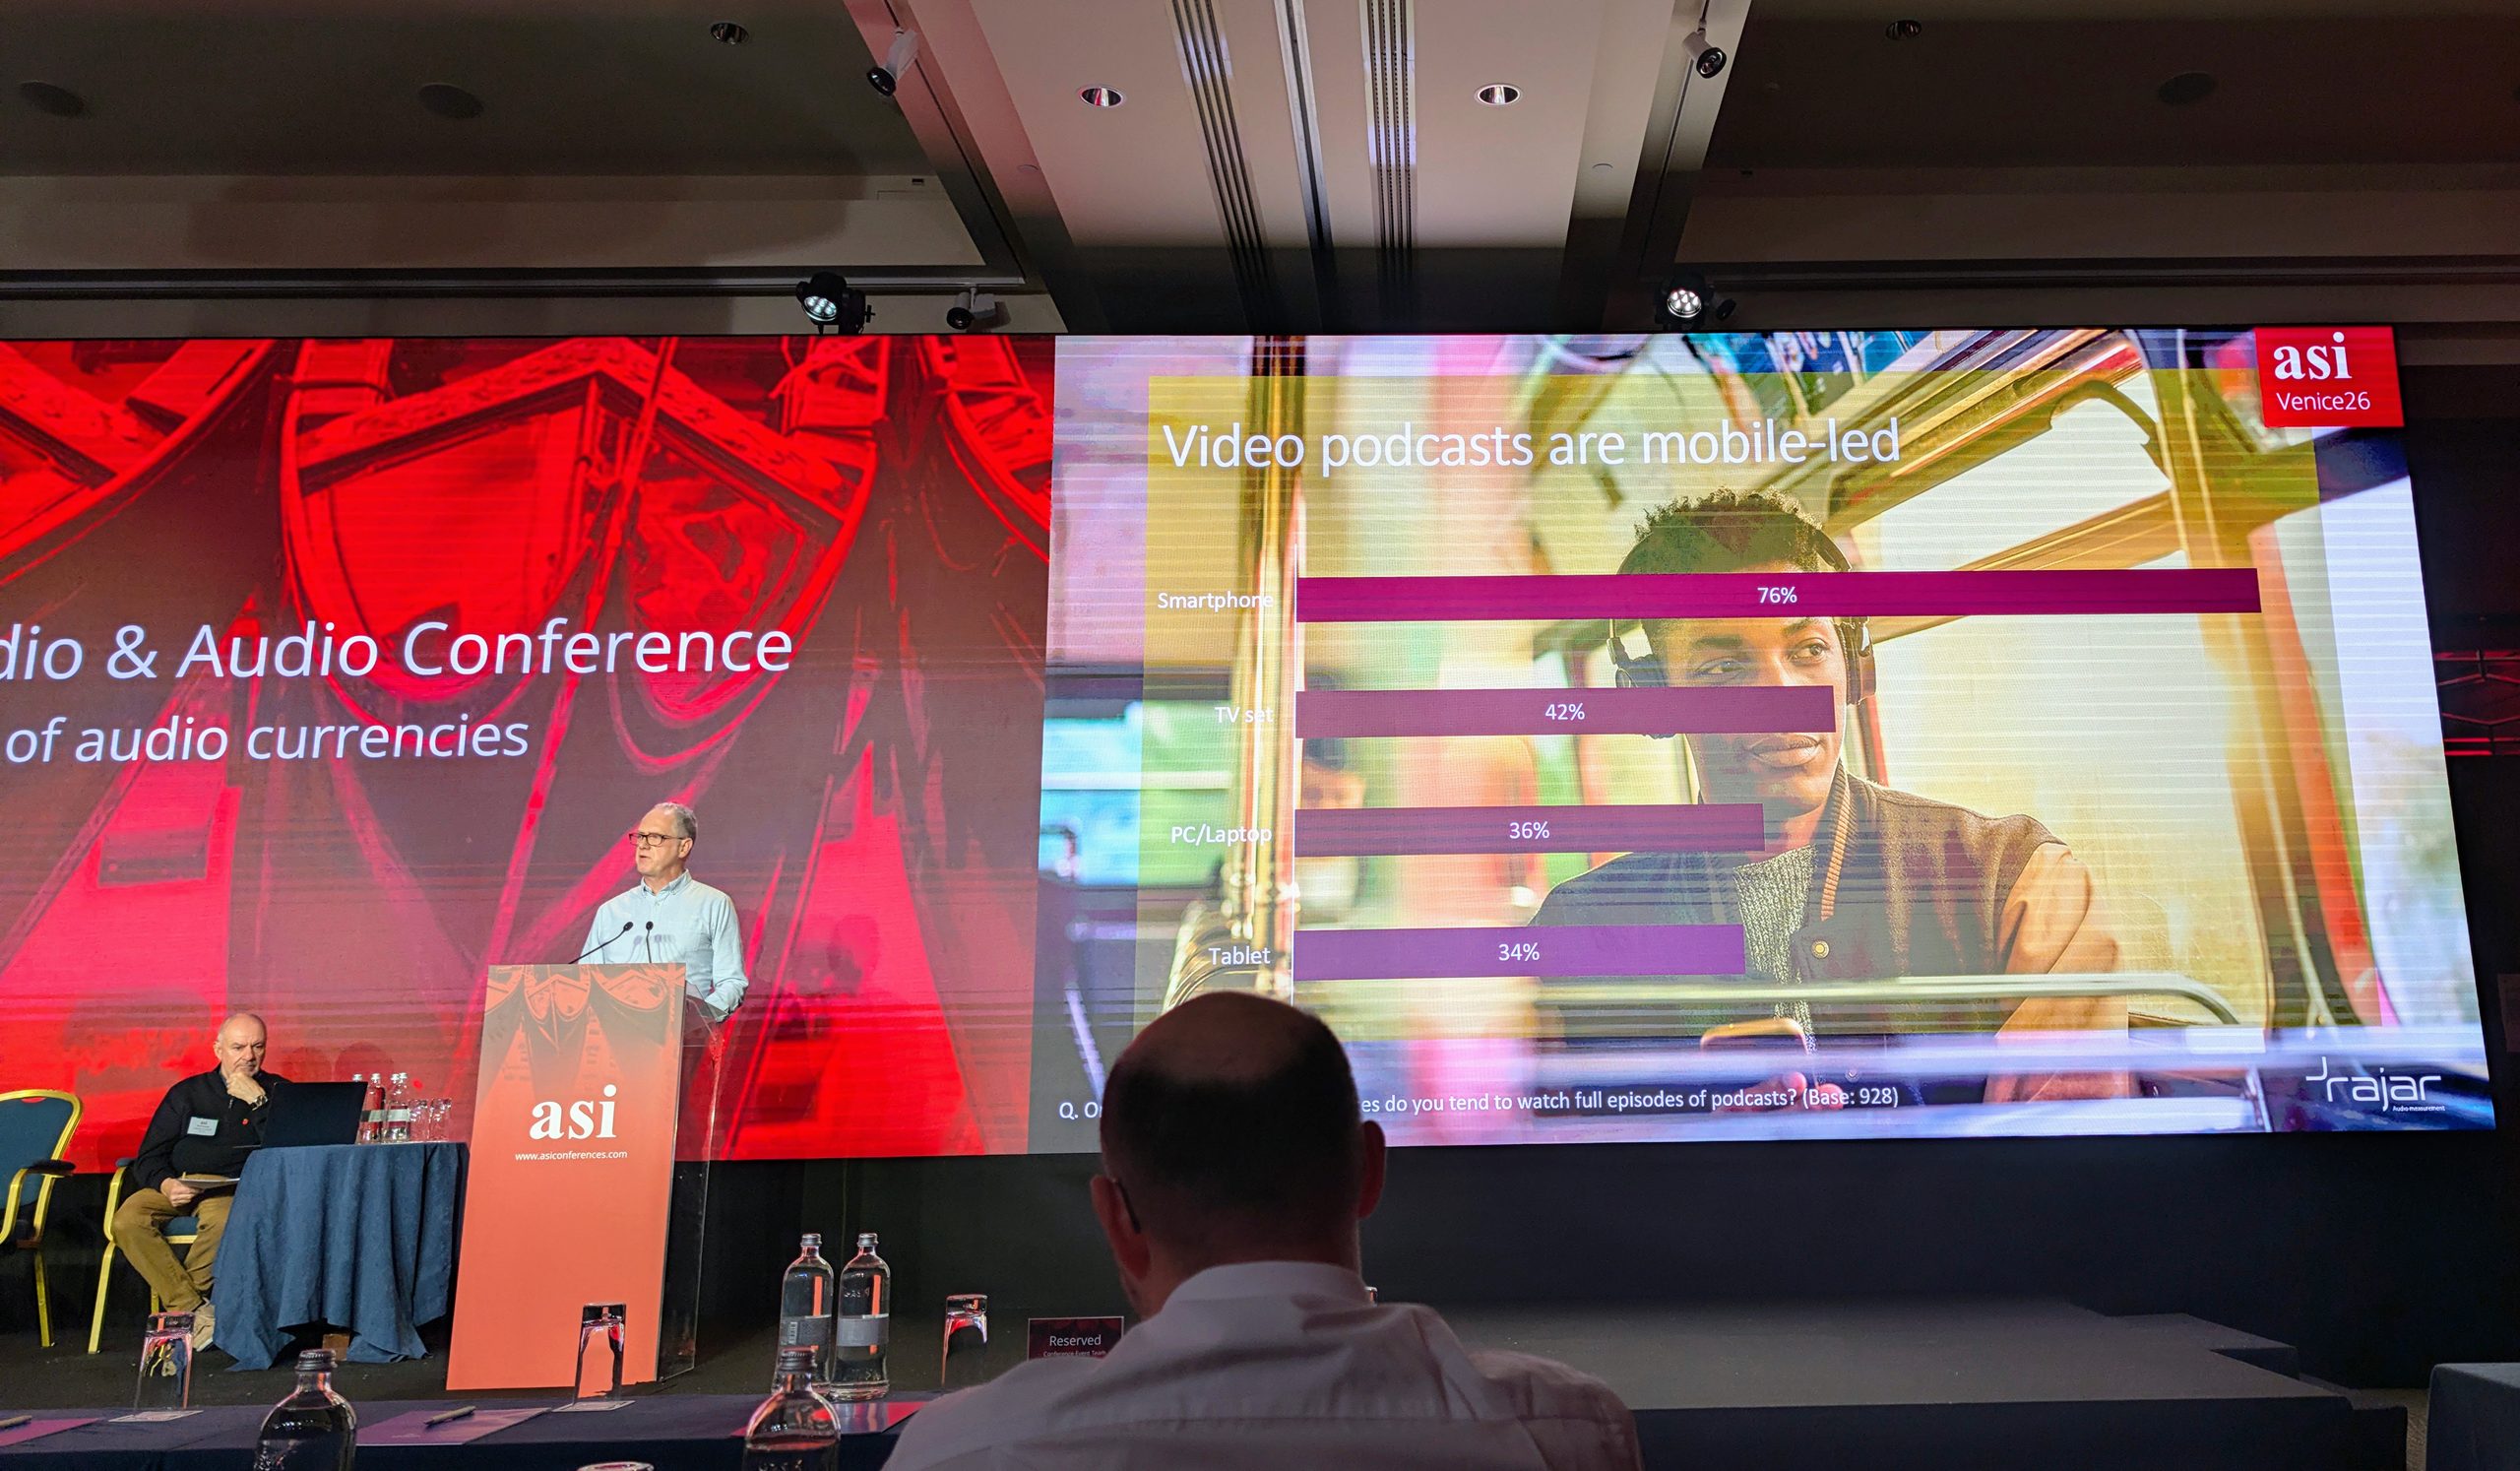
RAJAR found that 34% of audiences flip between audio and video in the course of a week. While 37% listen to audio, and 29% watch video. I also found it very interesting to see that video podcasts are significantly more likely to be viewed on a phone.
But it’s how people consume video podcasts that I found most interesting.
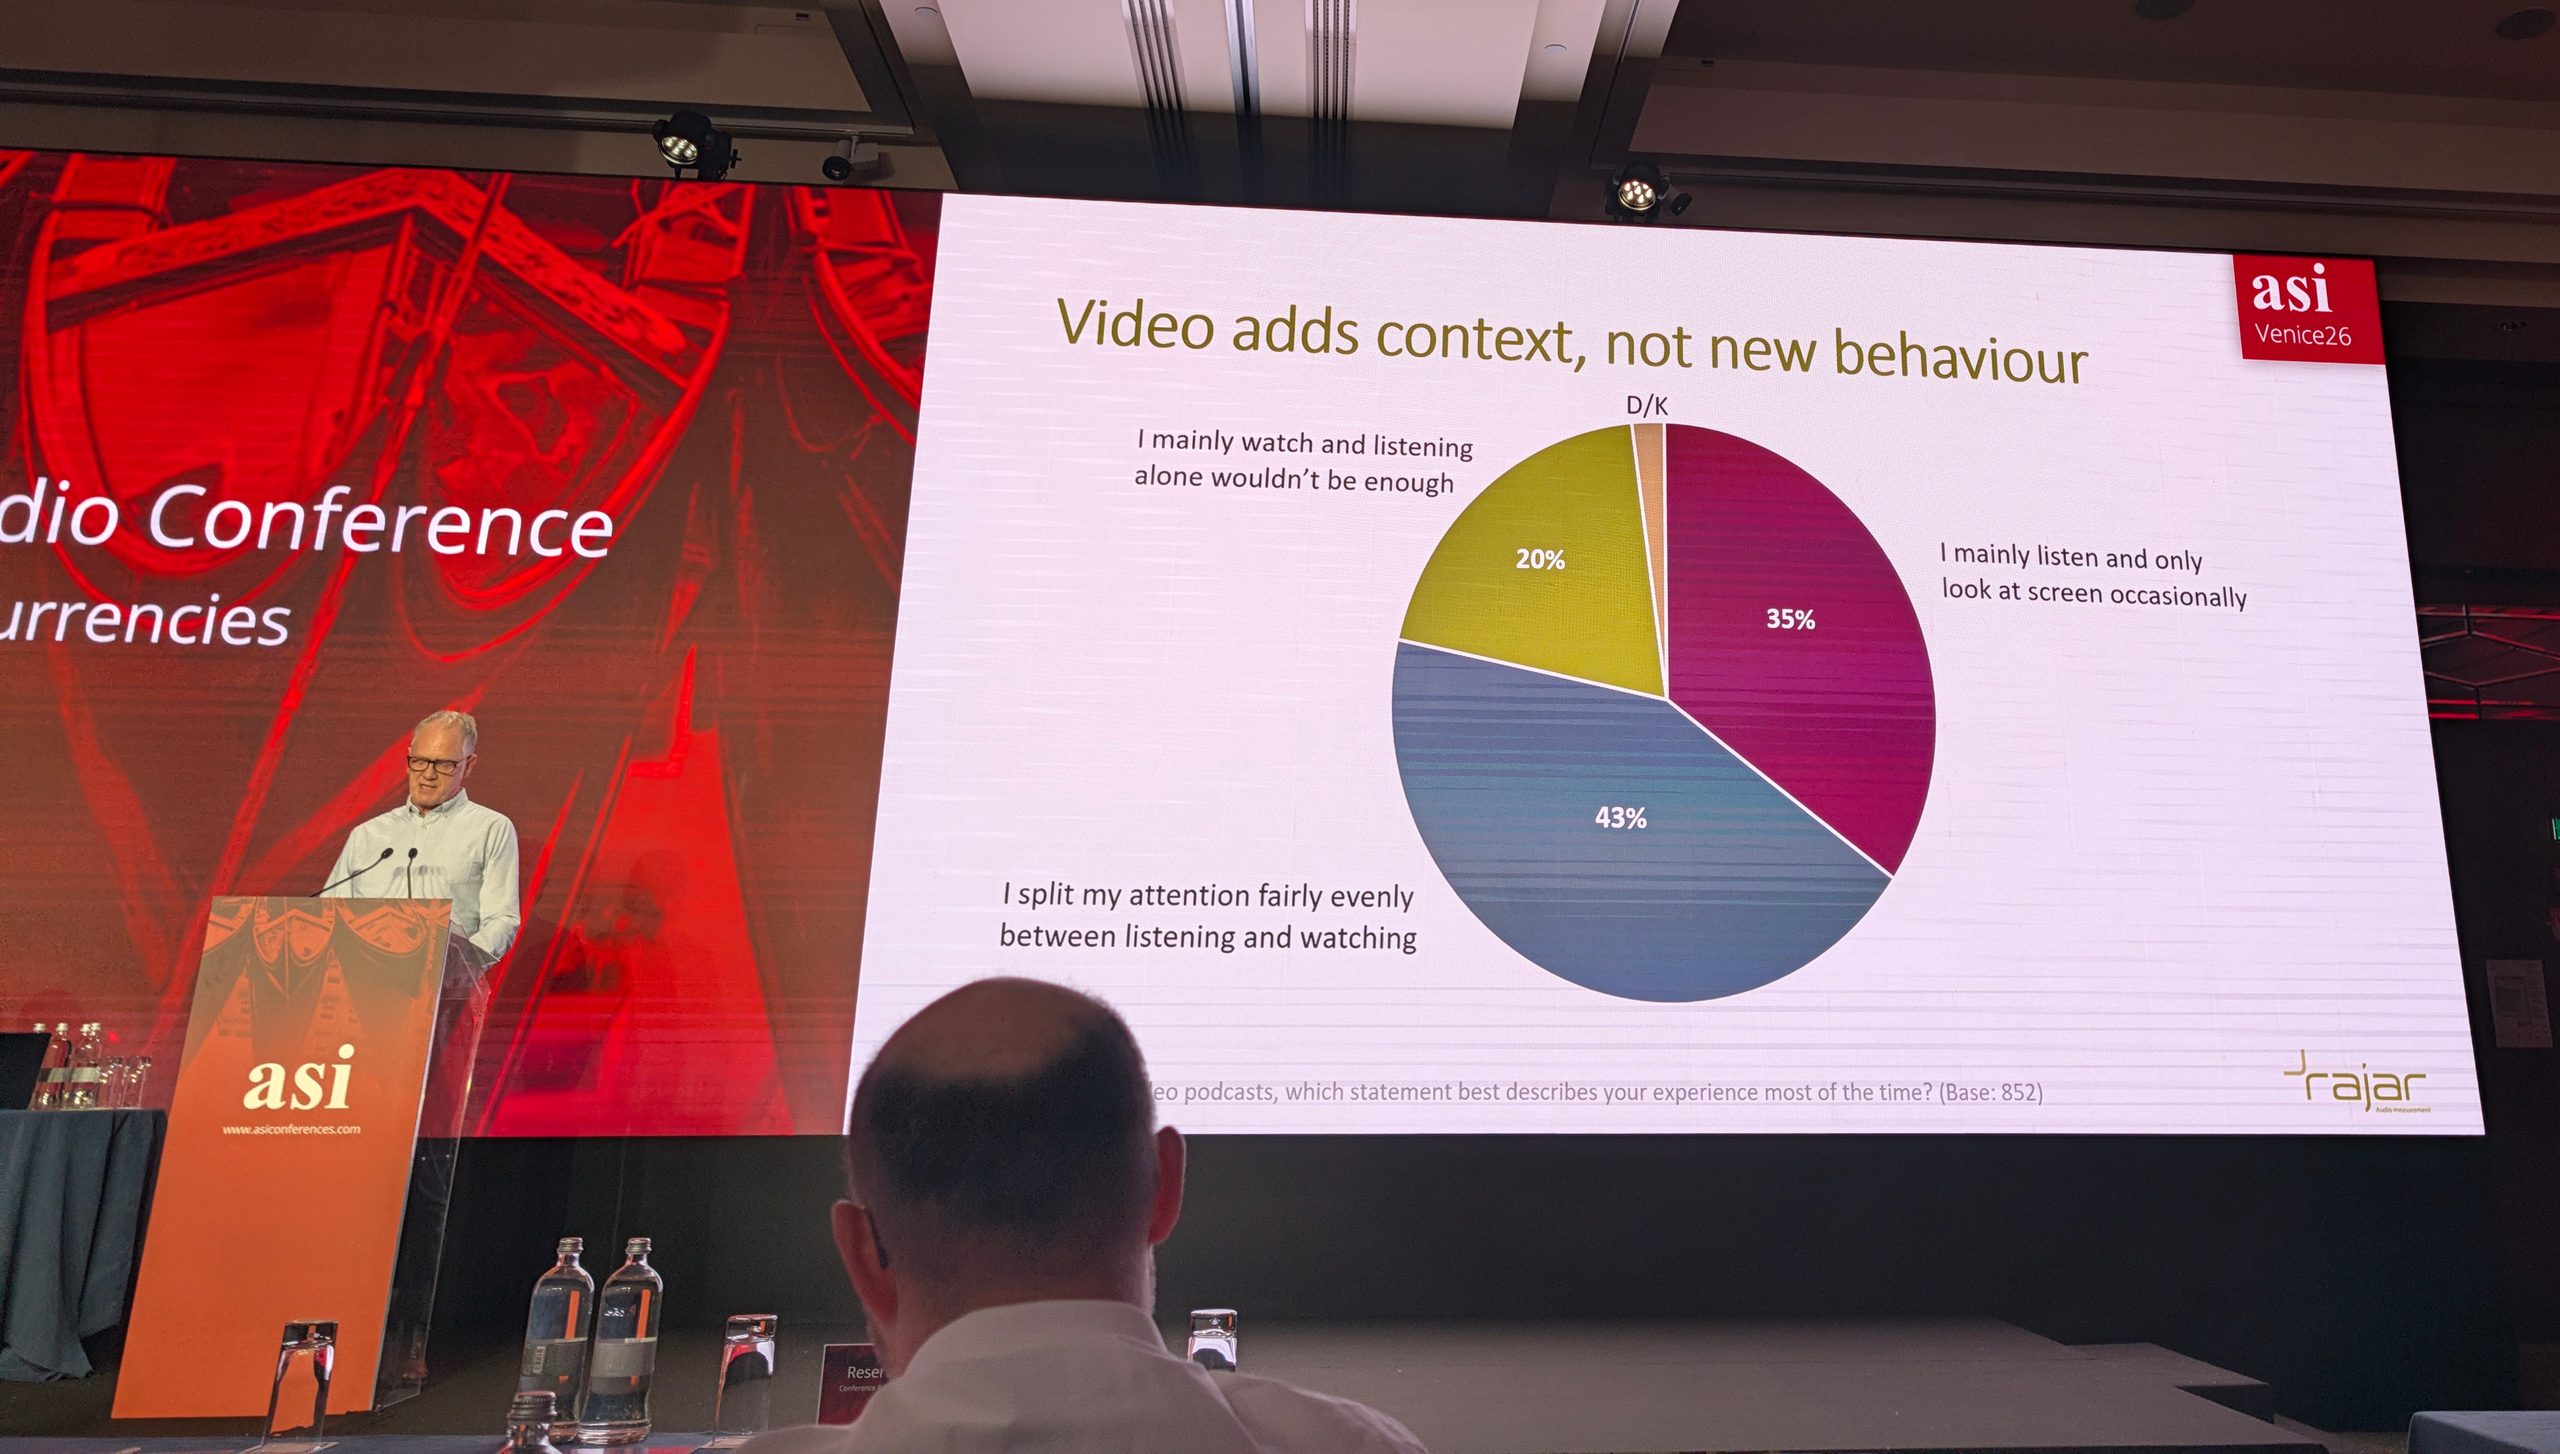
While 20% of video podcast listeners say that they mostly watch the podcasts in video form, 35% say that they mainly listen and only occassionally look at the screen, while 43% say that they split their time between listening and watching fairly evenly.
So that’s 78% of video podcast viewers only partially watching podcasts, with audio equally or more important to them.
While I’m surprised that TV viewing for video podcasts is so much lower than smartphone consumption (YouTube in general is much more even between smartphone and TV), the fact remains that this research suggests a lot of consumption of video podcasts is very secondary.
And RAJAR did ask about what else people were doing while consumed video podcasts.
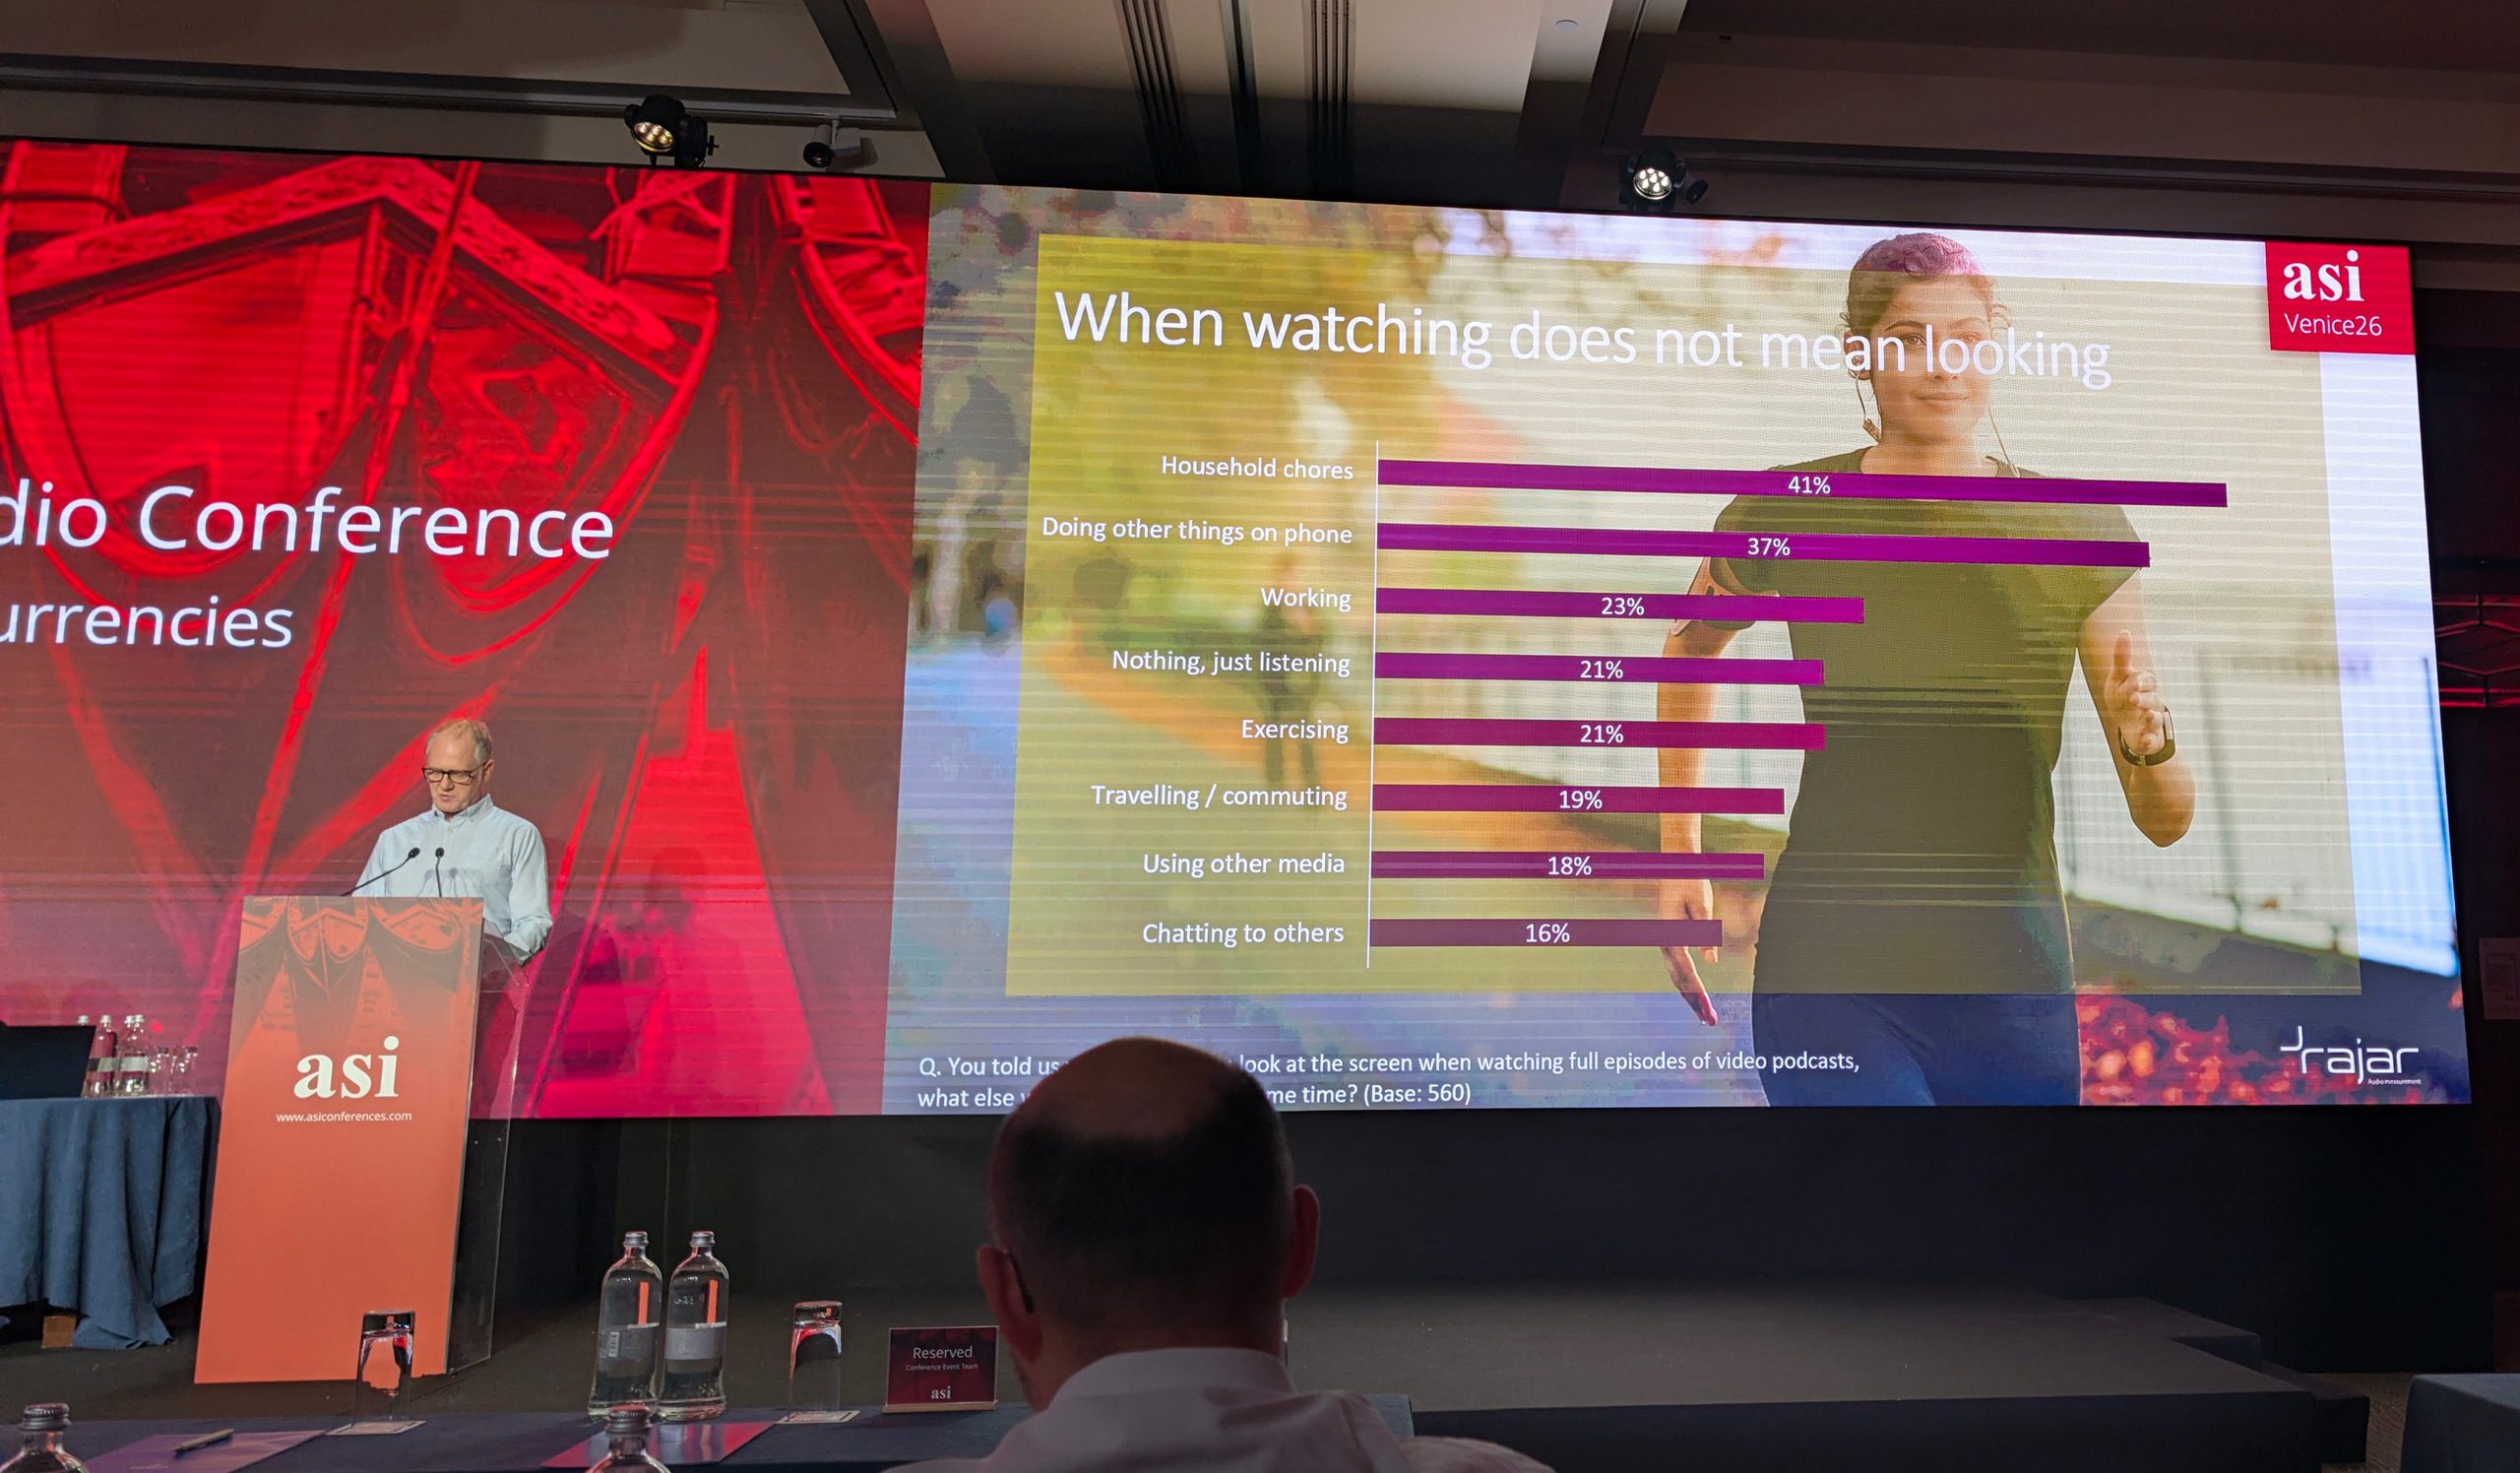
Household chores at 41% came out top. But doing other things with your phone was a close second at 37%. People are, unsurprisingly, doing a lot of other things.
Podcasts in video form are probably being treated the same way daytime television often is, or comfort-watching your favourite sitcom on a streaming service; it’s background entertainment to keep you company while you do something else, and while you’re broadly listening, you’re mostly likely only glancing from time to time at the screen, perhaps sometimes watching for a few minutes before another distraction comes along.
Sources: RAJAR MIDAS Autumn 2026/RAJAR November 2026
MIDAS Autumn 2026 fieldwork was carried out over two weeks in September 2026 with a final sample of 1,717 former RAJAR participants aged 15 plus who completed a 7-day online diary.
Leave a Reply